- 21 June 2024 (35 messages)
-
 Thank you, I'll removed those files since it will make problem in group archive.
 -
I'll try to test and investigate it this week.
-
-
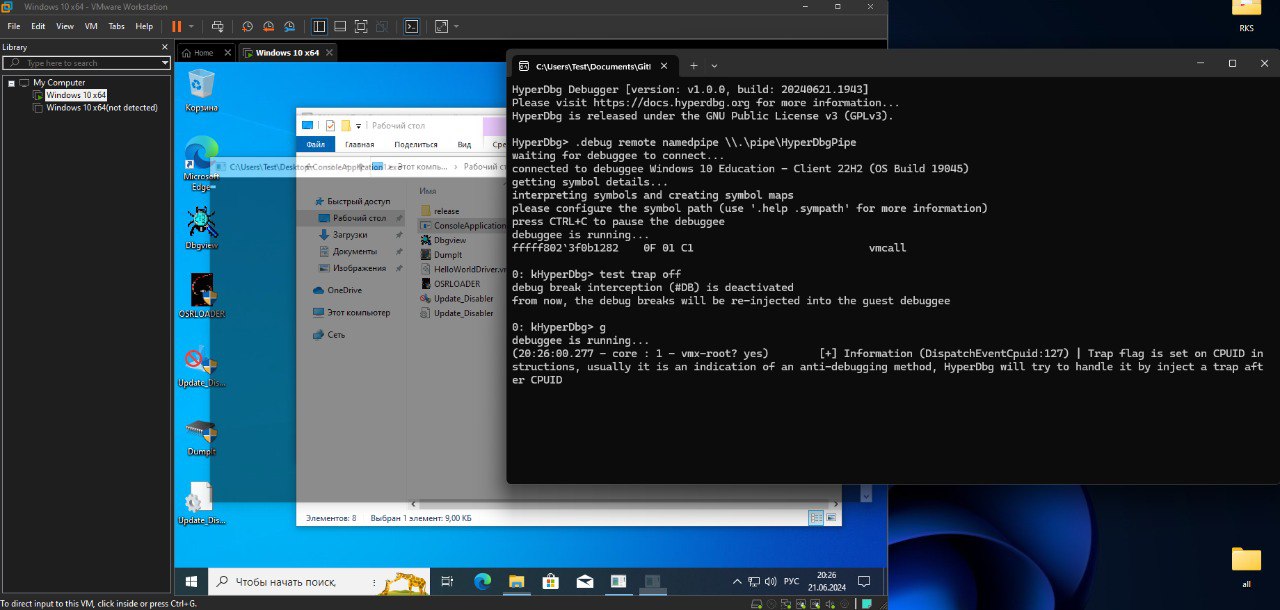
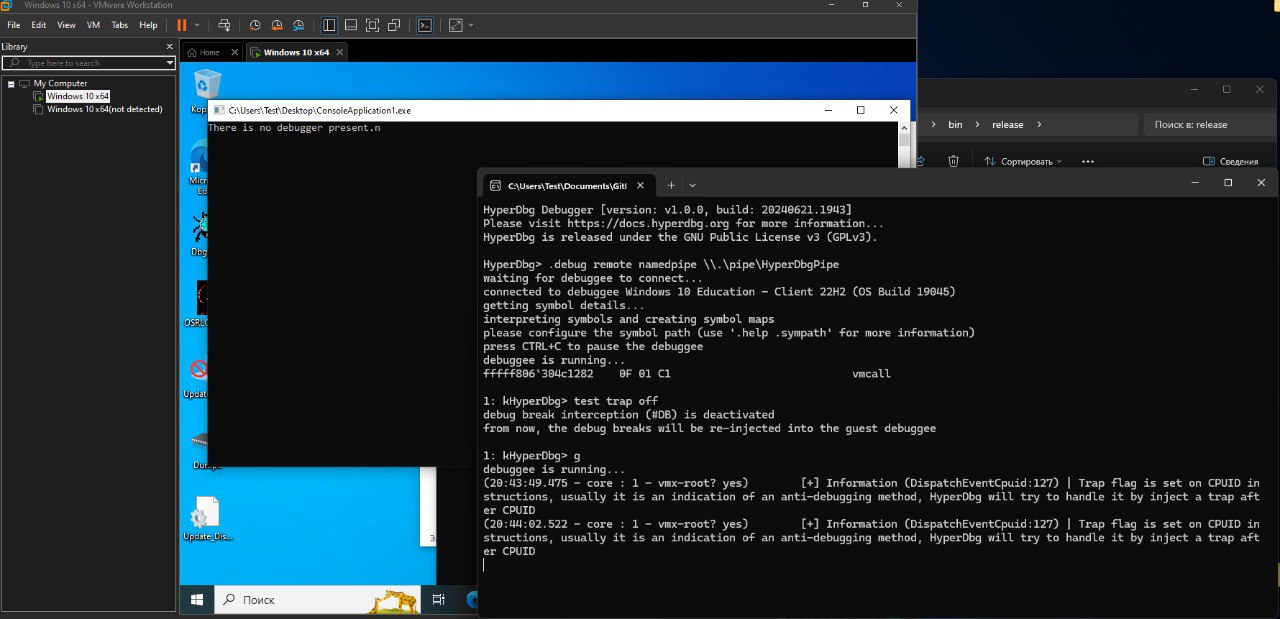
Whenever you run this code while HyperDbg is loaded it prints 'Debugger is present'? And once HyperDbg is unloaded it says it's not present? Am I right?
-
-
-
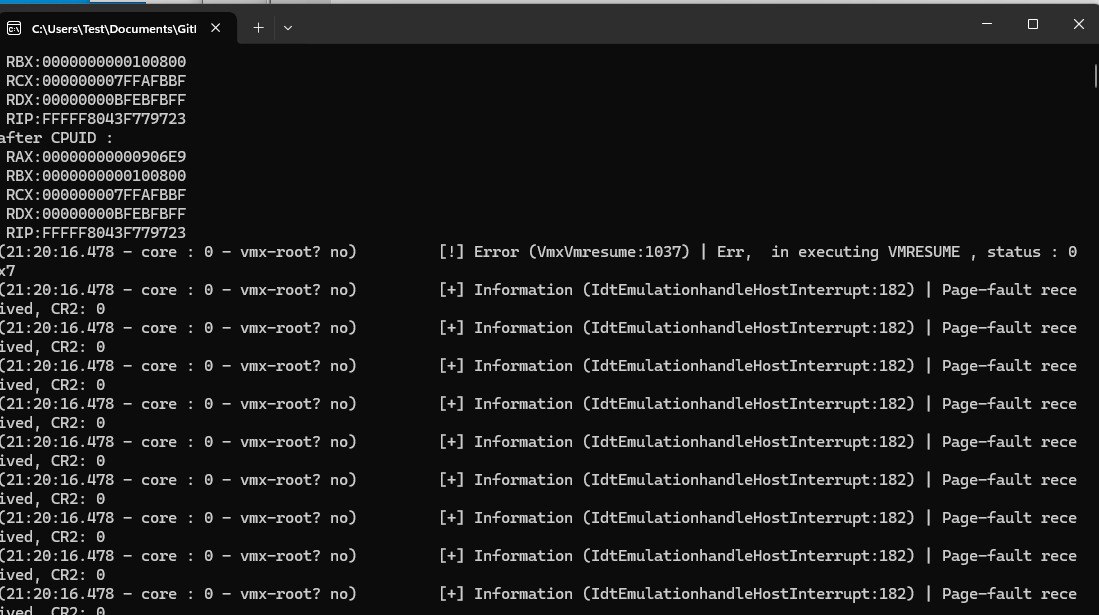
When the above application is running in HyperDbg system freezes? Is it the same for master branch too?
-
-
-
-
-
-
-
-
-
Joined.
-
 Hello, what software is the memory icon on the desktop?
 -
 Hello guys,
Hope you're doing well.
I would like to ask about some Idea in my head to see if it's easy to apply or not.
I want to build a hypervisor to virtualize my own system (an already running system), to monitor any target process for it's API calling, and send that as like a log to a user-mode engine to analyze the calling sequence and the parameters to decide whether it's a malicious process or not.
I want to build it as a PoC, it's doesn't need to be a real world project.
and I'm on my part 6 of Hypervisor from scratch series. so it's like would be easy to me after I finish the series to understand how to build this hypervisor (then I will decide to build a new one from scratch or use the HyperDbg to make this API call hooking for me). or I would need further reading to understand what I need to do. -
and sorry another Q.
when I virtualized a single core, I put the code to do so (set the affinity and configure the vmcs and do the vmclear ..etc) in the IRP_MJ_CREATE dispatch routine, I always faced a BSOD with error that it accessed a paged memory, while when I put the code in the driver entry the problem solved.
and When I analyzed the crash dump I saw that the crash happens when the user-mode app calls the CreateFile api to open a handle to the Driver. so I think the problem is that the DriverCreate dispatch routine is paged out. so how to make sure that's it's not paged ? -
- 22 June 2024 (3 messages)
-
Hi,
I think the best approach is to use HyperDbg as a library, since handling tasks like sending buffers from VMX root mode to user mode can be quite challenging. You'll read more about it in part 8. -
I don't have any idea about it, you are probably accessing an invalid memory address since paging is in effect when user to kernel switch happens, so I think being paged out doesn't make sense here.
-
But I didn't change anything when I tried to move the code to make it run in the Driver entry instead of the IRP_MJ_CREATE dispatch routine. I'm going to analyze the crush dump again to understand what happened. Thanks sina 😁❤️
- 23 June 2024 (4 messages)
-
-
 Joined.
 -
There is no official tutorial of how to use SDK but it's pretty straightforward. Take a look at how we used in hyperdbg-cli project and you'll understand how it works + plus you can modify the controller (hprdbgctrl) if it's needed.
https://github.com/HyperDbg/HyperDbg/blob/master/hyperdbg/hyperdbg-cli/hyperdbg-cli.cppHyperDbg/hyperdbg/hyperdbg-cli/hyperdbg-cli.cpp at master · HyperDbg/HyperDbgState-of-the-art native debugging tool. Contribute to HyperDbg/HyperDbg development by creating an account on GitHub.
-
- 24 June 2024 (3 messages)
-
I updated the 'dev' branch to fix phnt error.
Please clone HyperDbg again (either update submodules) or clone it like this:
git clone -b dev --recursive https://github.com/HyperDbg/HyperDbg.git
And confirm if it builds successfully in the latest SDK? -
Eduard
-
 yes, its building nice now :) thanks
 - 26 June 2024 (4 messages)
-
Can I clarify? ))
-
-
-
No, the physical serial connection is reported that it's not working as expected. You can search for the discussions in this group.
- 27 June 2024 (2 messages)
-

-
 Joined.
 - 28 June 2024 (4 messages)
-
-
Not sure if I understand what you mean. 🤨
What do you expect to happen when using the 't' command and the !epthook? -
I wanted to know if I could use !epthook as breakpoint for single step tracing (t)
-
- 29 June 2024 (10 messages)
-
-
You can use !epthook as a breakpoint but it's not good for doing single step.
-
Do want to make transparent stepping without trap flag? Am I right?
-
If yes, then you need to use the instrumentation step in the 'i' command).
-
The difference is in its implementation. This document explains the differences in the implementation:
https://research.hyperdbg.org/debugger/kernel-debugger-design.html
But in short, the 't' command is exactly implemented the same way that WinDbg or other debuggers implement their stepping mechanism. But the 'i' command is unique to HyperDbg as it guarantees that no core/process/thread got a chance to run except the target process. It's also transparent to the guest debuggee as it uses Monitor Tranp Flag (MTF) in the VMCS instead of Trap Flag, so the target application won't notice it since it wouldn't change anything within RFLAGs. Other than that, this stepping command is capable of stepping instructions from user-mode <> kernel-mode. For example, you can single step the SYSCALL instruction and go directly to the kernel syscall handler from user-mode. -
Thank you !
I usually debug using vmware. Is it possible to debug on a physical computer?(VMI mode seems to be) -
-
I put the epthook on the address and run the trace in steps (for example, t 1000) the trace passes the epthook and goes on)
-
@HughEverett found one thing - if i step over (p) some call and inside call process is terminated(or exception??) i cant pause debugger anymore, looks like it still waits for ret and does not meet it, ctrl-c not working
-
shall i create issue on github ?
- 30 June 2024 (20 messages)
-
Yes. In the VMI Mode, you could use all of HyperDbg features except pausing and stepping the debuggee.
-
Isn't it the expected behavior? 🤨
-
You mean if the 'p' is pressed and meanwhile the process is terminated, it waits forever for the step to return? Am I understand it correctly?
-
yes. next insturction is like call 0x2222222, i press p, inside 0x2222222 process is terminated(or exception thrown, i dont know exactly) step stays in debugger and i cant do anything about it
-
Yes, please create an issue in GitHub and describe it so I can fix it later.
Also, if you find a way to fix it, you can create a PR too. -
Also, FYI this one is added.
-
-
Please check it and let me know if it works as expected or not. It's on the 'dev' branch (not 'master' yet).
-
ok, i will try to prepare some synthetic test, to reproduce it
-
thanks
-
Step over hangs, if process terminates/excepts within call instruction. · Issue #406 · HyperDbg/HyperDbg
StepOverTst.zip Steps to reproduce: .start path C:\dbg\StepOverTst.exe 2: kHyperDbg> bp 00007ff7`54c3156c 2: kHyperDbg> g debuggee is running... breakpoint 0x3 hit 00007ff7`54c3156c E8 37 03 ...
-
HyperDbg v0.9.1 is released. 🎉
This release comes with bug fixes and introduces new pseudo-registers for timing. Other than that, our hardware debugger chip generator (hwdbg) is now able to run conditional statements and modify signals!
Check it out:
https://github.com/HyperDbg/HyperDbg/releases/tag/v0.9.1
Changelog:
### Added
- Regular port/pin value read and modification in hwdbg
- Conditional statement evaluation in hwdbg
- Added automatic script buffer packet generator for hwdbg
- Added support for @hw_pinX and @hw_portX registers
- Added hwdbg instance information interpreter
- Added stack buffer in vmx-root
- Exporting functions to support loading drivers with different names
- Exporting function to connect and load HyperDbg drivers
- Exporting function to connect and load HyperDbg drivers
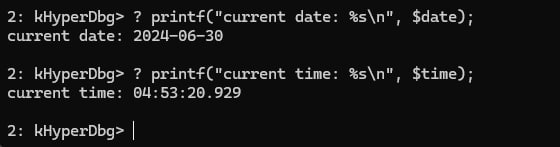
- $date and $time pseudo-registers are added
### Changed
- Fix using constant WSTRINGs in the wcsncmp function
- Fix phnt build error with 24H2 SDK
- hprdbgctrl.dll changed to libhyperdbg.dll
- hprdbgkd.sys changed to hyperkd.sys
- hprdbghv.dll changed to hyperhv.dll
- Dividing user/kernel exported headers in the SDKRelease v0.9.1 · HyperDbg/HyperDbgHyperDbg v0.9.1 is released! If you’re enjoying HyperDbg, don’t forget to give a star 🌟 on GitHub! Please visit Build & Install to configure the environment for running HyperDbg. Check out the ...
-
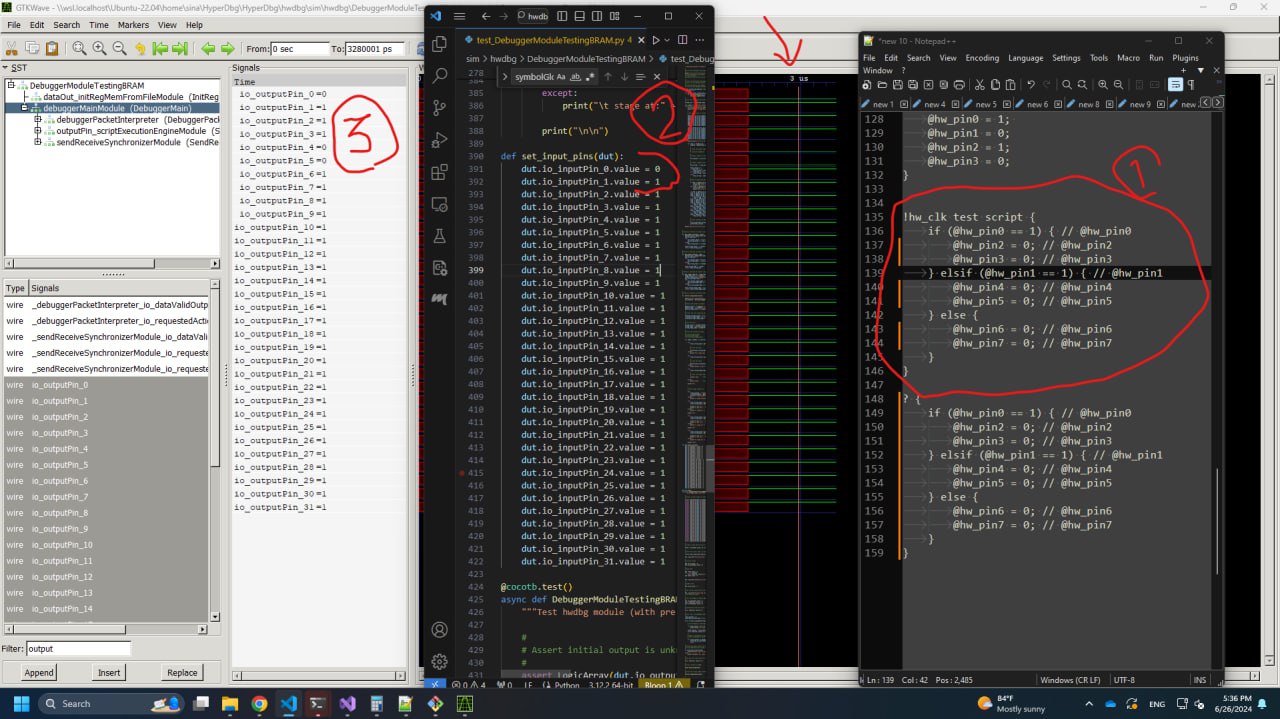
And this is the conditional statements in hwdbg:
-
-
The '$pid' pseudo-register shows you the process id, '$pname' for process name and '$proc' for nt!_EPROCESS of the target process that triggered the hook.
You can see the videos of session 5 of the OpenSecurityTrainings's HyperDbg tutorial which describes how to use EPT Hooks + session 4 which explains basic principles of the script engine:
https://youtu.be/tjsFRBFGis4?si=y1onPj-tzGXKUTVUDbg3301: HyperDbg 05 01 Intro and Classic Hidden HooksView the full free MOOC at https://ost2.fyi/Dbg3301. This course is an introductory guide to HyperDbg debugger, guiding you through the initial steps of using HyperDbg, covering essential concepts, principles, debugging functionalities, along with practical examples and numerous reverse engineering methods that are unique to HyperDbg. Whether you have an interest in reverse engineering or seek to elevate your reverse engineering skills with hypervisor-assisted approaches, this course provides a solid foundation for starting your journey.
-
-
Joined.
-
i connecting to a physical computer
.connect local
load vmm
how to run a step-by-step trace? -
-
@hyperdbg / Public archive of HyperDbg Telegram messages.

- 01 Jun 2024 (1)
- 03 Jun 2024 (3)
- 04 Jun 2024 (75)
- 05 Jun 2024 (2)
- 06 Jun 2024 (3)
- 08 Jun 2024 (3)
- 09 Jun 2024 (5)
- 10 Jun 2024 (2)
- 12 Jun 2024 (1)
- 13 Jun 2024 (98)
- 14 Jun 2024 (26)
- 15 Jun 2024 (31)
- 16 Jun 2024 (43)
- 17 Jun 2024 (93)
- 18 Jun 2024 (8)
- 19 Jun 2024 (25)
- 20 Jun 2024 (66)
- 21 Jun 2024 (35)
- 22 Jun 2024 (3)
- 23 Jun 2024 (4)
- 24 Jun 2024 (3)
- 26 Jun 2024 (4)
- 27 Jun 2024 (2)
- 28 Jun 2024 (4)
- 29 Jun 2024 (10)
- 30 Jun 2024 (20)