- 02 August 2023 (31 messages)
-
Suspending processes in Windows | j00ru//vx tech blog
https://j00ru.vexillium.org/2009/08/suspending-processes-in-windows/Suspending processes in Windows | j00ru//vx tech blogI have been recently encountering quite a non-typical problem - playing Starcraft was hard due to the amount of active processes running on my operating system - including a few IDA instances, virtual machines and the most disturbing... Firefox web browser. As we all know, it's not only about the memory being used by Firefox
-
-
-
-
-
-
-
-
-
-
 I have to decompile it to see how it works. Because, we have to be sure that the NtSuspendProcess won't access a memory address which might be paged-out.
 -
-
-
-
-
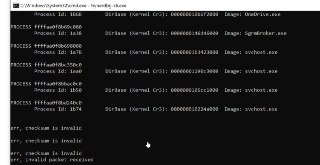
 No, we can't just call it and expect the suspension. Once you pause the system (CTRL+C), HyperDbg halts everything in VMX root. The problem is we can't call this function from VMX root-mode.
 -
Hyperdbg Instalacion en dos VM y nuevos features(Hyperdbg Instalation in two VM and new features.)
https://drive.google.com/file/d/1S6Dz2qqYYDD3gMxDwVFf0ihobulhMrRP/view?usp=sharing empacado password a
-
-
-
 Yes. My current idea (which needs some time to implement) is changing the RIP.
 -
 And intercepting page-faults (#PF) in HyperDbg on the target process.
 -
-
 And instead of re-injecting page-faults, just ignore them (until Windows thread scheduler decides to context-switch the process).
 -
 and this way implement this mechanism.
 -
-
-
 Exactly same as using (event_sc()) function in '!monitor x ...'
 -
 It just blocks the execution in the target page and won't let it run.
 -
 We could do the same for the '!loop' or whatever command, but we need to be cautious not blocking execution of other threads.
 -
 I need some time fixing a rare raise condition that happens in the 't' stepping, after that, I try to get into this mechanism and implement it.
 -
- 03 August 2023 (17 messages)
-
-
-
-
Joined.
-
-
-
-
-
-
-
-
 Yes, this is really good advice! 👌
I'll add it to the todo list. -
 👌
👌 -
 🤨🤨🤨
🤨🤨🤨 -
 Is it just one time produced? Or it keeps showing this message? Can it be reproduced? 🤔
 -
-
- 04 August 2023 (50 messages)
-
-
-
-
-
-
-
-
-
-
-
-
-
-
-
-
-
 You mean the '!monitor' is executed before the trap flag?
 -
-
-
-
-
 🤔
🤔 -
-
 oh, got it.
 -
 that's a nice trick 👌
 -
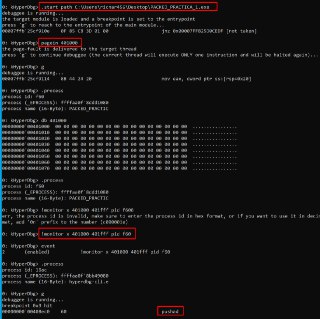
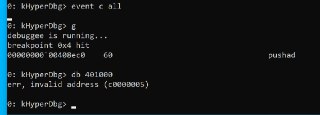
.start path C:\Users\ricnar456\Desktop\PACKED_PRACTICA_1.exe
pagein 401000
!monitor x 401000 401fff pid f60
g
we are in entry point with monitor enabled
00000000`00408ec0 60 pushad
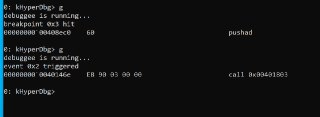
0: kHyperDbg> g
debuggee is running...
event 0x2 triggered
00000000`0040146e E8 90 03 00 00 call 0x00401803 -
-
 but even though it works, it doesn't necessarily guarantee this behavior. 🤔
or am I wrong? 🧐 -
-
-
-
 you're right.
 -
 it should work in most of the cases.
 -
-
-
-
-
-
 By the way, you can use another trick as well. I don't know if you notified it or not but once you load a process, if you loaded it again (.start), while the previous process is not yet closed, the page tables are valid for the target process is also valid for the second process. You can use this trick too.
 -
 And it comes from the fact that Windows allocates memory for each process (static module codes) only once and reuse it in different instances of the same process.
 -
-
-
-
 Is the target address dynamically allocated?
 -
-
-
 🤔
🤔 -
-
 maybe I'm wrong, or it has other conditions that I do not know. 🤔
 -
Joined.
- 06 August 2023 (50 messages)
-
Joined.
-
Hi, I'm new to hyperdbg and I'm trying to set it up with two vmware fusion VMs in debugger mode. I see that adding serial ports to vmware fusion isn't as straight forward as vmware Workstation. Could someone guide me how to turn on "cpu yield on poll" option and specify which machine is the server and vice versa. Thanks
-
 Hi, would you please first verify whether HyperDbg is working on VMI mode (local debugging) or not?
 -
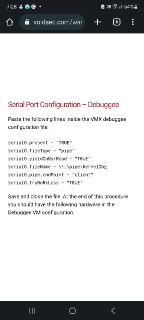
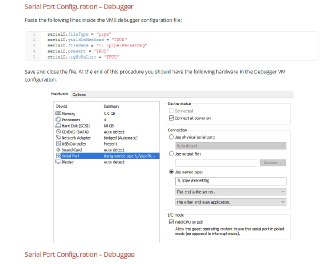
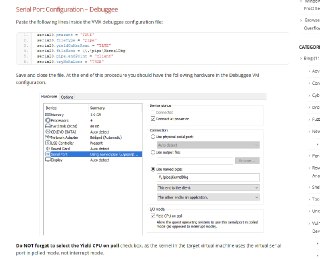
 Besides that, I'm not sure if VMware fusion has some configuration similar to VMware Workstation, but in case, if it's similar, you need something like this:
 -

-
 Windows Kernel Debugging & Exploitation Part1 – Setting up the lab - VoidSec
How-to set up a VMware lab with Windows Kernel mode debugging enabled via Serial Port (or UART), a step by step guide.
-
 Please note the third line in the configuration.
 -
thanks a lot @HughEverett , i will give it a go. I haven't tried it in VMI first
-
could you also share the config for server/debugger side
-
 Both of them are available in the above link.
 -

-
I am getting BSOD after running ".debug prepare serial 115200 com2"
-
 Did you connect to serial?
 -
 because in VMI mode, the 'debug' command should not be used.
 -
yes i connected in serial after adding the pipe config to .vmx
-
i now tried vmi mode and that is working fine with .connect command
-
just having BSOD with serial connection using .debug commands
-
 Are you testing with the 'master' branch? or the 'dev' branch?
 -
i took the latest compiled release
-
 because there was a problem recently reported and fixed in the 'dev' branch but is not yet merged to the 'master'.
 -
 Can you compile the 'dev' branch
 -
 ?
? -
I can try yes
-
 okay, test with the 'dev' branch and let me know about the results.
 -
-
-
 I think we have enough commits to release HyperDbg v0.5.
 -
 Let me fix a small issue I noticed in the showing context message
 -
-
 and after that, will release the new version.
 -
 optional recheck? 🤨
 -
-
-
-
-
 We can release it but this needs some tests before release. So, I think it's better to release the v0.5 now to at least fix the problem with VMware workstations checksum error, and after that we'll get to this optional recheck. Is it okay?
 -
-
 👍
👍 -
i compiled the dev branch and I am not facing the BSOD, so thanks a lot. But now i keep getting "is the debugger listening? retry handshaking with the debugger... (timeout: 5 seconds)"
-
debugger .vmx:
serial0.fileType = "pipe"
serial0.yieldOnMsrRead = "TRUE"
serial0.fileName = "\\.\pipe\KernelDbg"
serial0.present = "True"
serial0.tryNoRxLoss = "True"
debuggee .vmx:
serial0.fileType = "pipe"
serial0.yieldOnMsrRead = "TRUE"
serial0.fileName = "\\.\pipe\KernelDbg"
serial0.present = "True"
serial0.tryNoRxLoss = "True"
serial0.pipe.endPoint = "client"
HyperDbg> .debug remote serial 115200 com2
HyperDbg> .debug prepare serial 115200 com2
I have tried different combinations of comX but no use -
 Joined.
 -
-
i am doing that, ran .debug remote on debugger end
-
.debug prepare on debuggee side
-
-
-
issue is with the way i am setting up serial ports in vmware fusion. as it is quite different from windows counterpart (vmware workstation)
-
 hi there, anyone knows if I can somehow load the hyperdbg driver by manual mapping, I'm trying to debug a protected game but it doesn't allow me to run it with test signing enabled
 -
guys if anyone can guide me how i can debug the serial ports issue. this is how i am creating them on vmware fusion
https://communities.vmware.com/t5/VMware-Fusion-Discussions/Add-Network-Serial-Port-in-Fusion/td-p/480346Add Network Serial Port in FusionTook awhile but I figured out how to connect to a network serial port in Fusion on my Mac. PITA. Step 1: Don't boot the VM Step 2: Add a serial port and chose a bogus file for it Step 3: Go into the VMX file. For me, I had to right click the VM file, select "Show Package Contents" then open vmN...
-
I keep getting "is the debugger listening? retry handshaking with the debugger... (timeout: 5 seconds)"
- 07 August 2023 (123 messages)
-
Btw does the !monitor command work for memory ranges in kernel space?
-
 No this simply means that the handshake mechanism which was added recently won't work. And the reason for that is the connection problem. HyperDbg cannot send data over serial.
 -
 Yes, it works on both user-mode and kernel-mode.
 -
 So, the serial configuration that I previously sent to you is problematic here. As nothing is received. You can verify it by a simple serial port monitor and send program like putty or XCTU.
 -
 BTW, what do you trying to know? I mean if you just want to observe the locations where RWX happens, you can create a log in the VMI mode without a serial connection.
 -
 What do you mean by manual mapping?
 -
 I think he meant allocating a pool, manually relocating image/fixing imports, overwriting the allocated pool using the vuln driver
 -

-
 🤔
🤔 -
 GitHub - TheCruZ/kdmapper: KDMapper is a simple tool that exploits iqvw64e.sys Intel driver to manually map non-signed drivers in memory
KDMapper is a simple tool that exploits iqvw64e.sys Intel driver to manually map non-signed drivers in memory - GitHub - TheCruZ/kdmapper: KDMapper is a simple tool that exploits iqvw64e.sys Intel ...
-

-

-

-
 Does supporting it need any special consideration on the HyperDbg driver?
 -
 I mean it would probably be a pain to support this and only gamehackers are going to use it like that
 -
 Oh. I'm not sure honestly, probably not. You can treat it like a normal driver but you don't have the driver object(the one that gets passed to the DriverEntry)
 -
 you also can't use SEH loading a driver this way
 -
 I mean. You can, but it requires a lil bit of modifications to the kdmapper project driver that you are "manually mapping"
 -
 interesting, I thought supporting it for manually mapped drivers is such an esoteric knowledge only known to true windows kernel wizards lol
 -
 Not really. You can just google it, the thing is that it won't be pg-compatible, but as for the hyperdbg driver, it is using some pg detected stuff anyways so it won't be an issue lol
 -
 anyways, I think adding support for this would be awesome because I don't really see any real practical use for hyperdbg except for debugging anti-cheats and also rootkits maybe? But technically speaking, anti-cheats are also rootkits lol. Please correct me if I am wrong here.
 -
 hey
hey -
 anyone know for what i get CLOCK_WATCHDOG_TIEMOUT
 -
 with my HYPERVISOR
 -

-
 This can have thousands of reasons, what did you change that leads to this?
 -
I need to break the kernel to figure out the location of the buffers i want to monitor for RWX
-
 In VMI mode, you can view (create logs) from the changed buffers, but, you can pause the kernel.
 -
 Can you verify the serial connection? Is it working properly?
 -
I will work on serial connection
-
Can or can't?
-
 Can't halt (pause) the system in VMI mode. But you can create logs.
 -
 Basically, you need something like this in VMI mode:
!monitor rw 0xfff1234 0xfff1234+100 script {
printf("The address: %llx is modified from: %llx\n", $context, @rip);
} -
 This script works perfectly in VMI mode.
 -
 HyperDbg v0.5 is released.
https://github.com/HyperDbg/HyperDbg/releases
Added
The event calling stage mechanism
New pseudo-registers ($stage) in the script engine
Changed
The disassembler now warns if you mistakenly used the 'u' command over a 32-bit program
The debuggee won't load the VMM module if the debugger is not listening
The debugger and the debuggee now perform a version/build check to prevent version mismatch
Fix the 'eb' command's parsing issue with '0xeb' hex bytes
Fix the connection problem with serial (checksum error) over two VMs
Fix the 't' command's indicator of trap flags and simulatenous stepping of multiple threads
Fix the problem with the '.kill' and '.restart' commands
Show the stage of event once the debugger is paused
Fix sending context, tag, and registers once '!epthook2' wants to halt the debugger -
 And also, this is the description of the new 'calling stage' mechanism:
https://docs.hyperdbg.org/tips-and-tricks/misc/event-calling-stageEvent calling stageThe event calling stage in HyperDbg
-
-
-
-
 Do you have any idea why? Does it have something in TLS?
 -
-
-
-
 Weird, how it can find a chance to run code. 🤔
I don't know if there is anything other than TLS, that is executed before the entrypoint. 🤨 -
-
 Yeah. Send it please.
 -
-
@sina still getting BSOD with .debug prepare command with dev branch binary and 0.5 release. what could i be doing wrong
-
listen/.connect work fine
-
-
-
both VMs win10, debugger and debuggee
-
-
same issue with BSOD?
-
-
-
-
Windows 10 Home 22H2
-
-
-
19045.2965
-
yup
-
-
-
-
it's a 2019 intel mac
-
2.6 GHz 6-Core Intel Core i7
-
-
-
-
-
-
i7-9750H
-
damn
-
bad luck
-
-
that's extremely unlucky on my part
-
i am in dire need of !monitor functionality as hardware breakpoints can't help me
-
you know of some other tool or technique that i could use?
-
need to monitor a buffer for reads
-
-
-
-
-
I don't but I could set one up. The research that i am conducting has been with win 10 so far so switching OS won't be an option for me
-
-
did you have the same issue? .connect works but not .debug
-
-
-
-
-
got it
-
thanks
-
@HughEverett could anything be done to fix this issue for this specific processor+win10?
-
-
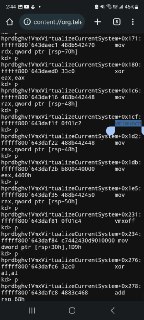
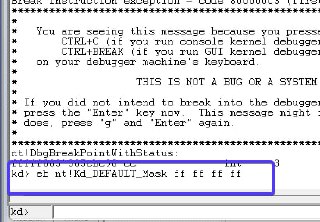
: kd> g
Break instruction exception - code 80000003 (first chance)
hprdbghv+0x8cf9:
fffff801`24958cf9 cc int 3
2: kd> g
Break instruction exception - code 80000003 (first chance)
hprdbghv+0x8cf9:
fffff801`24958cf9 cc int 3
0: kd> g
KDTARGET: Refreshing KD connection
*** Fatal System Error: 0x0000003b
(0x00000000C000001D,0xFFFFF80124958D52,0xFFFFF9072196F840,0x0000000000000000)
Break instruction exception - code 80000003 (first chance)
A fatal system error has occurred.
Debugger entered on first try; Bugcheck callbacks have not been invoked.
A fatal system error has occurred.
nt!DbgBreakPointWithStatus:
fffff807`3d5cbc90 cc int 3
0: kd> g -
-
-
-
-
-
-
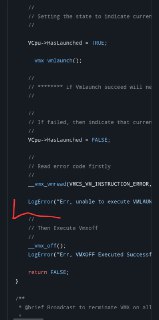
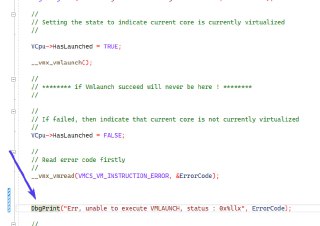
As VMLAUNCH is failed, the entire virtualization routine will be failed.
-
-
-
-
-
-
-
-
VCpu->HasLaunched = TRUE;
__vmx_vmlaunch();
//
// ******** if Vmlaunch succeed will never be here ! ********
//
//
// If failed, then indicate that current core is not currently virtualized
//
VCpu->HasLaunched = FALSE;
//
// Read error code firstly
//
__vmx_vmread(VMCS_VM_INSTRUCTION_ERROR, &ErrorCode);
LogError("Err, unable to execute VMLAUNCH, status : 0x%llx", ErrorCode); -
-
-
-
-
-
-
-
-
-
-
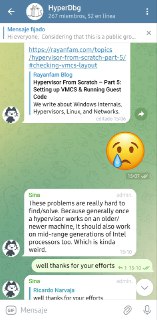
No, it's an Intel-ish issue with the layout of hypervisor.
https://rayanfam.com/topics/hypervisor-from-scratch-part-5/#checking-vmcs-layoutHypervisor From Scratch – Part 5: Setting up VMCS & Running Guest CodeWe write about Windows Internals, Hypervisors, Linux, and Networks.
-
- 08 August 2023 (21 messages)
-
 Probably no, as long as I don't have a physical access to such a computer. But as @ricnar mentioned, the problem with this version is really weird, I don't know what's happening there that VMLANCH fails to execute.
But, one thing that was interesting for me was the fact that you said the '.connect' works, basically there is no difference between the '.debug' and the '.connect'. Are you loading the driver successfully? 'load vmm'? Or just connecting without loading the driver? -
I just run .debug commands on both sides and get bsod. in case of .connect i do the same, i start listen command on debuggee and then run .connect on the other
-
 and the '.connect' bsod the debuggee too? or not?
 -
Nope
-
 😳
😳 -
Just .debug BSODs the debuggee
-
I am exporting the VMs to a different laptop for now
-
 So, this is not same as the problem @ricnar mentioned.
 -
I'm not sure what processor that one has
-
 This problem could be fixed, if you can setup a WinDbg (kdnet) to test it.
 -
Ahan
-
 Do you have visual studio (+WDK)? If you can allocate some time for it, we could debug HyperDbg together step-by-step here to find the problem and fix it.
 -
I do have it setup. VS+wdk. But it's on my debugger VM. Which is also win 10
-
I can confirm first if that VM gets BSOD or not
-
 Windows 10 is pretty okay. Once HyperDbg crashes the system, WinDbg will detect it. After that, we can investigate through the '!analayze -v' results.
 -
 Hey, I'm trying to make a python script in which I load the HyperDbg DLLs and use them to send commands and receive their outputs. Specifically, I want this to work with scripts.
Ex:
HyperDbgInterpreter('? printf(@rax); ')
---> Callback:
read() -> "123"
Sadly, neither HPRDBGCTRL.HyperDbgInterpreter(), nor script-engine.ScriptEngineSetTextMessageCallback() are triggered for PRINTF() or PRINT().
Any help? -
 here's my current script:
import ctypes
def test_callback(txt: ctypes.c_char_p) -> int:
print("AAAAAAAAAAAAAAAAAAAAA")
return 0
if __name__ == "__main__":
# Load HyperDbgCTRL into memory
hdbg_script_dll = ctypes.cdll.LoadLibrary("./script-engine.dll")
proto_callback = ctypes.WINFUNCTYPE(
ctypes.c_int, # Return type
ctypes.c_char_p # Param 1
)
cb = proto_callback(test_callback)
hdbg_script_dll.ScriptEngineSetTextMessageCallback(cb)
hdbg_dll = ctypes.cdll.LoadLibrary("./HPRDBGCTRL.dll")
# hdbg_dll.HyperDbgSetTextMessageCallback(cb) <-- also doesn't work
hdbg_dll.HyperDbgInterpreter(ctypes.c_char_p(b"!? printf(\"asdasdyasd\");")) -
 Looked into it further and
ScriptEngineFunctionPrint(UINT64 Tag, BOOLEAN ImmediateMessagePassing, UINT64 Value)
{
#ifdef SCRIPT_ENGINE_USER_MODE
ShowMessages("%llx\n", Value);
#endif // SCRIPT_ENGINE_USER_MODE
#ifdef SCRIPT_ENGINE_KERNEL_MODE
//
// Prepare a buffer to bypass allocating a huge stack space for logging
//
char TempBuffer[20] = {0};
UINT32 TempBufferLen = sprintf(TempBuffer, "%llx", Value);
LogSimpleWithTag(Tag, ImmediateMessagePassing, TempBuffer, TempBufferLen + 1);
#endif // SCRIPT_ENGINE_KERNEL_MODE
}
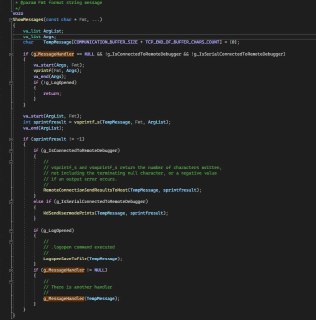
should internally be calling g_MessageHandler() in ShowMessages() ?? -

-

-
Would it work if we analyze the crash on debuggee VM that doesn't have VS? I can attach windbg to it over network as i already do
Or do I need VS+wdk in the machine being analyzed for crash - 09 August 2023 (186 messages)
-
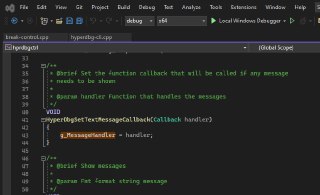
 Hi, you need to register your custom 'printf-like' function there. You used ScriptEngineSetTextMessageCallback, but that's wrong, this function should be called instead: HyperDbgSetTextMessageCallback.
 -

-
 And ShowMessages() will eventually call it.
 -
 VS+WDK makes us able to test and fix codes with more flexibility but it's not necessary. Only having WinDbg '!analyze -v' results most of the times works as well.
 -
I'll send you the output of the command
-
Setup info: win10 debugger vm running windbg and hyperdbg .debug remote command
debuggee VM being debugged by the first VM and i launch .debug prepare
output:
HyperDbg> .debug prepare serial 115200 com1
current processor vendor is : GenuineIntel
virtualization technology is vt-x
vmx operation is supported by your processor
err, a device attached to the system is not functioning
vmx feature might be disabled from BIOS or VBS/HVCI is active
failed to install or load the driver -
vt-x is enabled from vmware
-
i don't see an option for vmx in vmware bios
-
 Driver signature enforcement is disabled?
 -
 Yes
Yes -
 How did you disable it?
 -
 I did once during startup and once through cmd bcdedit + restart
 -
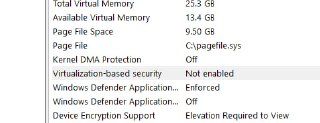
 Can you verify it in the "System Information"?
 -

-
 This one.
 -
I checked in the task manager under processor and it didn't show up there. Just said virtual processor: 1
-
Let me check
-
-
 You run the Windows with Test Mode?
 -
 Am I right?
 -
i don't think so. in this case to debug using windbg i run in debug mode
-
when i was getting BSOD i was not running in debug mode
-
 WinDbg is connected to the VM?
 -
yes right now
-
and no BSOD since windbg is connected
-
 And you cannot load HyperDbg driver?
 -
 🤨🤨🤨
🤨🤨🤨 -
how do i do that manually? i am just running .debug prepare and getting that error
-
 I didn't get the point. WinDbg is connectd to the guest but you get this error?
 -
yes
-
 this one.
 -
yes
-
 It's super weird 🙂
 -
-
 The right picture is in the VMware?
 -
 VBS is disabled in both sides?
 -
yes, two separate VMs
-
VBS might be on on debugger side let me confirm
-
it is disabled on both ends
-
 and also can you confirm that the debugger VM (WinDbg) is able to pause the debuggee VM?
 -
it is
-
 This is weird, maybe previously loaded HyperDbg driver which not yet unloaded?
 -
could be
-
 Can you delete HyperDbg files (including drivers) without annotations (like it's used by other process)?
 -
 I'm gonna see whether the driver files are previously loaded or not.
 -
i have 3 different release folder on this system
-
i should delete all 3?
-
 yes
yes -
0.4 and 0.5 and dev
-
ok
-
 because we don't know which one is still loaded in the system.
 -
aha, latest release folder not being deleted
-
files in use
-
 Go on the same file (that won't be deleted), then use 'connect local' and 'load vmm'
 -
 after that, run 'unload remove vmm'
 -
 to delete the drivers.
 -
cli exe deleted
-
just left with drivers in that folder
-
 no worries, copy the cli from whatever version you have
 -
ok
-
HyperDbg> connect local
local debugging (vmi-mode)
HyperDbg> load vmm
loading the vmm driver
current processor vendor is : GenuineIntel
virtualization technology is vt-x
vmx operation is supported by your processor
err, a device attached to the system is not functioning
vmx feature might be disabled from BIOS or VBS/HVCI is active
failed to install or load the driver
HyperDbg> unload remove vmm
there is nothing to unload
the driver is removed
HyperDbg> -
deleted the folder and now it is deleted
-
should i try .debug prepare now
-
or just load vmm first
-
 yes
yes -
 I think it's better to first run it locally 'connect local' 'load vmm'
 -
 to make sure that it works in VMI Mode.
 -
 After that 'unload remove vmm'
 -
 Once we confirm that it works in VMI Mode, we will get to the '.debug' problem.
 -
one more question
-
should i do thiss with windbg connected
-
 yes
yes -
ok
-
HyperDbg> connect local
local debugging (vmi-mode)
HyperDbg> load vmm
loading the vmm driver
current processor vendor is : GenuineIntel
virtualization technology is vt-x
vmx operation is supported by your processor
err, a device attached to the system is not functioning
vmx feature might be disabled from BIOS or VBS/HVCI is active
failed to install or load the driver -
😕
-
with windbg connected driver sig option shouldn't be an issue right?
-
 yes
yes -
 that's why I say it's weird
 -
 Generally, HyperDbg shows this message only if the error message of driver loading indicates an integrity error.
 -
 I don't have any idea which component is preventing it from running
 -
debuggee vm has an AV installed, debugger vm doesn't. will try load vmm on debugger vm
-
same issue sadly, testsigning on still this. no AV here either
HyperDbg> .connect local
local debugging (vmi-mode)
HyperDbg> load vmm
loading the vmm driver
err, failed loading driver
it's because either the driver signature enforcement is enabled or HVCI prevents the driver from loading
you should disable the driver signature enforcement by attaching WinDbg or from the boot menu
if the driver signature enforcement is disabled, HVCI might prevent the driver from loading
HyperDbg is not compatible with Virtualization Based Security (VBS)
please follow the instructions from: https://docs.hyperdbg.org/getting-started/build-and-install
unable to install VMM driver
failed to install or load the driverBuild & InstallThis document helps you to build and install HyperDbg
-
is there a way to confirm driver sig enforcement being off?
-
 🤔
🤔 -
any way to confirm this "Driver signature enforcement is disabled?"
-
 Did you also test this method?
https://www.tenforums.com/tutorials/156602-how-enable-disable-driver-signature-enforcement-windows-10-a.htmlHow to Enable or Disable Driver Signature Enforcement in Windows 10 - Windows 10 Help ForumsHow to Enable or Disable Driver Signature Enforcement and Test Mode in Windows 10
-
bcdedit /set testsigning on
-
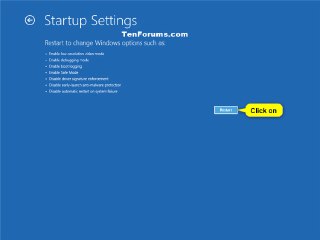
 No, I mean pressing shift and restarting
 -
this method is in there
-
i can try that
-
lemme see
-

-
 This one
 -
yes let me try on this VM
-
i did try this before
-
i tried this method and now i have BSOD
-
means driver probably got loaded but i got BSOD
-
 yes, it means that HyperDbg's driver is loaded
 -
 yes
yes -
yes
-
i now need to recreate with windbg connected
-
 Did you run '.connect' or '.debug'?
 -
i did load vmm after .connect local
-
 .
. -
 Are experiencing this BSOD on '.connect' for the first time?
 -
only on load vmm
-
 I thought the problem is only for the '.debug'.
 -
i guess it is with driver being loaded
-
when i did .connect in past
-
i did not do local VMI
-
i did remote
-
and no BSOD occurred
-
i did not load driver manually with "load vmm" either
-
 Okay, I hope that we don't conclude that the error is because of 'error number 7', with 'Guest Invalid State' of the VMLAUNCH instruction.
 -
 Because, this is something that processor doesn't give more information about what exactly happened and can have thousands of reasons.
 -
!analyze -v won't help debug this?
-
 If this is a CPU error, then no. It won't help. It's not a software error, CPU throws it without further information. WinDbg can tell us that the reason for error is because CPU gave this error, but it doesn't have further information why this error happens.
 -
i see
-
maybe i should try importing my VMs to a separate PC them
-
then*
-
can't believe my luck 🙁 both my laptops have the exact same CPU, macbook pro i7-9750H and XPS 7590 with i7-9750H
-
-
-
-
-
maybe i could try that yes
-
thanks for the suggestion
-
-
-
-
 🤨🤨🤨
🤨🤨🤨 -
 Really? It works on Win 11 with a 9 gen Intel processor?
 -
 What could be wrong 🤔
 -
@HughEverett just attached windbg to the crashed VM, will share crash logs
-
I don't know
-
 This shows that, something is changed in Windows that we didn't notice. 🤔🤔🤔
 -
-
i really hope this can be fixed for windows 10 plus same cpu :p
-
-
not for the past 3 4 months
-
but i can't update it now
-
-
can't change the research setup
-
-
 But it's kinda weird, because the first release of HyperDbg was developed on a Skylake 6 gen Intel CPU. After that, I moved to a 12 gen Alder Lake processor. But, I didn't change anything special since then. That's why it should be compatible with older processors as well.
 -
-
say something that gives hope now :p
-
 Can you load the pdb file of the hprdbghv and get the result of '!analyze -v' again?
 -
could share the pdb files for release 0.5?
-
 Yes
Yes -
more than happy to
-
 Of course, use the pdb file of the version that you used in VM
 -
 Why? 😅
 -
i mean i am happy to load pdbs to debug the issue :p
-
 It doesn't necessarily lead to solving the issue 😁😅
 -
i hope it does :p
-
 Debugging HyperDbg is really hard. I can't count the number of times, HyperDbg crashed random processes in the system without a clue of what's happening there. 🤪
 -
understandable it isnt a small program
-
 There are some facilities there like 'LogInfo' macro function designed to debug HyperDbg by sending the information out in the serial port before crashing the entire system.
 -
failed to reproduce crash but running load vmm produced this in windbg
kd> g
Break instruction exception - code 80000003 (first chance)
hprdbghv!AsmVmxSaveState+0x29:
fffff800`22388cf9 cc int 3 -
i think i haven't been able to produce the crash with windbg attached
-
-
 Bad news, this is the same error @ricnar encountered.
 -
-
-
i see
-
-
-
i did
-
no bsod
-
failed to load driver
-
does anyone know of a technique or tool that can produce results like !monitor
-
my usecase is to find the address of a buffer when it is being written to (achieved with windbg) then put basically a hardware bp on whole buffer to see where it is accessed again
-
-
yup. so anything like !monitor
-
that can be done without hyperdbg
-
-
-
kernel
-
and i think i can't change page protection in my case as it is kernel
-
@HughEverett any ideas?
-
 As it's in kernel, probably the only option is HyperDbg.
 -
 Also, ddimon has this functionality but didn't test it:
https://github.com/tandasat/DdiMonGitHub - tandasat/DdiMon: Monitoring and controlling kernel API calls with stealth hook using EPTMonitoring and controlling kernel API calls with stealth hook using EPT - GitHub - tandasat/DdiMon: Monitoring and controlling kernel API calls with stealth hook using EPT
-
-
-
- 10 August 2023 (1 messages)
-
 Joined.
 - 12 August 2023 (3 messages)
-
 Joined.
 -
 How can I do a step-by-step tracing on amd-v(svm)?
 -
 Hi,
Hi,
If you mean simple tracing (like WinDbg's "t" command) then you can use WinDbg or if it's a user-mode application both WinDbg and x64dbg. I'm sure x64dbg has some tracing facilities. But, if you are looking for something like instrumentation step-in in HyperDbg (user-mode to kernel-mode), I can't think of any alternative way other than HyoerDbg on Intel processors. Maybe 'dtrace' can help but I'm even not sure if it works on AMD processors or not. - 13 August 2023 (4 messages)
-
 Joined.
 -
Joined.
-
Hello,
What is the HyperDbg and what can i do with hyperdbg? -
 I thought it’s common sense to check manual/guide before asking “what my computer do” kind questions😓
 - 15 August 2023 (1 messages)
-
 Joined.
 - 18 August 2023 (1 messages)
-
Joined.
- 21 August 2023 (165 messages)
-
Joined.
-
-
-
-
 header value?
 -
-
-
-
 what kind of value?
 -
-
 Would you please send me the file.
 -
 I'm gonna test it now
- 02 Aug 2023 (31)
- 03 Aug 2023 (17)
- 04 Aug 2023 (50)
- 06 Aug 2023 (50)
- 07 Aug 2023 (123)
- 08 Aug 2023 (21)
- 09 Aug 2023 (186)
- 10 Aug 2023 (1)
- 12 Aug 2023 (3)
- 13 Aug 2023 (4)
- 15 Aug 2023 (1)
- 18 Aug 2023 (1)
- 21 Aug 2023 (165)
- 22 Aug 2023 (35)
- 26 Aug 2023 (2)
- 27 Aug 2023 (1)
- 28 Aug 2023 (14)
- 29 Aug 2023 (14)
- 30 Aug 2023 (38)
