- 21 August 2023 (165 messages)
-
-
-
-
-
-
-
 that's why it's weird, generally, it shouldn't be problematic as you mentioned nothing is executed before it, but I suspect maybe the PE headers might be manipulated.
 -
-
-
-
-
-
-
 I'm gonna check it now
 -
-
-
-

-
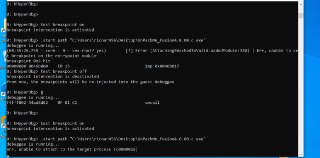
 The '.start' command seems to work perfectly. But let me check whether it find the debugger based on the breakpoint or not
 -
-
-
 No, just move it simply to the target and disabled the Windows Defender as it finds it malicious
 -
-
-
-
-
 Are you using the latest builds of HyperDbg master or dev branch?
 -
-
 older versions?
 -
-
-
-
 let me see how it detects the debugger
 -
-
-
 I'm gonna see how we can bypass its mitigations now
 -
 @ricnar did you attach WinDbg to disable Patchguard and DSE?
 -
 I run the packed sample on HyperDbg and it runs without error
 -
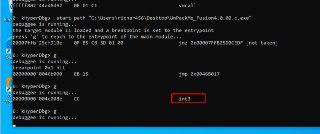
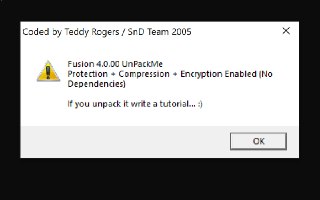
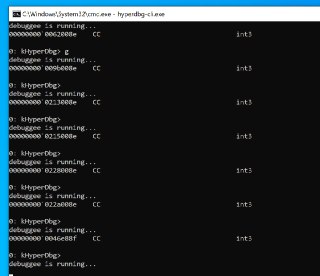
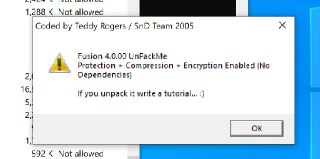
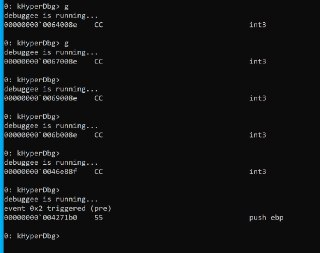
 The way that this packer detects the debugger is triggering a breakpoint and check whether the breakpoint is handled by any debugger or through its SEH routines. Once it successfully determine that the breakpoint not supposed to run within a debugger, it continues its normal execution
 -
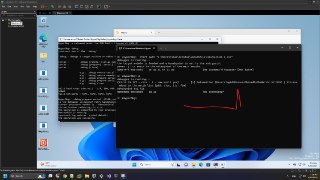
 Let me create a video and explain it from the video.
 -
 BTW, you can either pass all the breakpoints to the debugger by using the
test breakpoint off
command (which also breaks the '.start' interception),
or you need to have function to re-inject the event (int 3) back to the debugger. -
nop
-
-
-
 How?
How? -
 The only way to disable this from what I knew is EfiGuard
 -
-
 oh, okay
 -
-
-
 this is not a good idea as it won't disable patchguard
 -
 let me create the video now, I'll also show EfiGuard in the video
 -
-
-

-
-
-
-
-
-
-
 but it detects the debugger?
 -
 Am I right?
 -
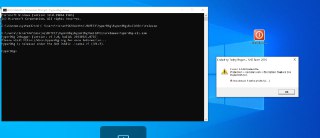
 There is anti-debugging breakpoint there. Did it triggered for you?
 -
-
-
-
-
 And after continuing it, it closes
 -
-
-
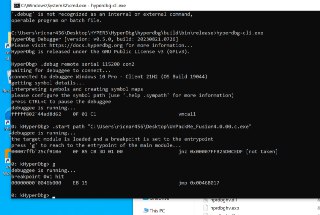
 so the problem is this breakpoint.
 -
 Start it again
 -
 and reach to the entrypoint but don't continue
 -
-
-
 After that, run this command:
test breakpoint off -
 and then press 'g'
 -
-
 I know, I'm gonna show you how you can avoid triggering breakpoint in HyperDbg
 -
-
-
-
 But, again one problem is here
 -
 the problem is that you can't use breakpoints this way
 -
-
-
-
 because you turned off HyperDbg's ability to intercept breakpoints (which also ruins the '.start' command).
 -
 But I have a better idea
 -
-
 what if you can re-inject the breakpoint without disabling it? 🧐
 -
-
-
-
 I mean, I'm gonna add a script engine function that makes you able to re-inject a #BP into the guest, once a breakpoint is detect (e.g., in this special addresss).
 -
-
 This should be easy to implement, I'm gonna implement this functionality now.
 -
-
-
 No, not at all. We have such a functions in HyperDbg, I'm just gonna export it to the script engine.
 -
-
-
-
 🤔
🤔 -
 No, it should work.
 -
-
-
-
 🤨🤨
🤨🤨 -
 what do you mean? monitor cannot view two thing at the same time?
 -
-
-
-
-
-
-
-
-
 test breakpoint is not a good idea for handling this situation. It breaks the '.start' functionality.
 -
 The solution to these kind of problems is event injection, but generally you can use 'test breakpoint on' to enable it.
 -
-
-
-
-
-
 😅😅😅
😅😅😅 -
 The reason is that Windows doesn't noticed that we modified this page
 -
 and thinks that it's not modified while maintaining it in the memory
 -
 and that's why it still triggers the breakpoint.
 -
-
Joined.
-
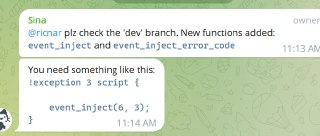
 @ricnar plz check the 'dev' branch. New functions added: event_inject and event_inject_error_code
 -
 You need something like this:
!exception 3 script {
event_inject(6, 3);
} -
-
-
 I didn't document these functions yet but the first argument is interruption type :
INTERRUPT_TYPE_EXTERNAL_INTERRUPT = 0,
INTERRUPT_TYPE_RESERVED = 1,
INTERRUPT_TYPE_NMI = 2,
INTERRUPT_TYPE_HARDWARE_EXCEPTION = 3,
INTERRUPT_TYPE_SOFTWARE_INTERRUPT = 4,
INTERRUPT_TYPE_PRIVILEGED_SOFTWARE_INTERRUPT = 5,
INTERRUPT_TYPE_SOFTWARE_EXCEPTION = 6,
INTERRUPT_TYPE_OTHER_EVENT = 7 -
 And the second argument is vector number.
 -
 So, a breakpoint is basically a software breakpoint (INTERRUPT_TYPE_SOFTWARE_INTERRUPT) and the vector (IDT Index) of the breakpoint (#BP) is 3.
 -

-
-
-
 Do you mean the file that you upload it here?
 -
-
-
 This is the same file that you sent
 -
 I test it with your file.
 -
 This video.
 -
-
-
-
-
 👍
👍 - 22 August 2023 (35 messages)
-
-
-
-

-
-
-
-
-
-
-
-
-
-
 yeah this event injection is a thing that we should've add long time ago. It's really useful. You can also use it to force injecting faults/exceptions/interrupts. Like injecting keyboard interrupts or any other PMIO or MMIO devices as well as software exception/fault injections of any kind.
 -
-
-
 That should be easy to implement. As it's basically same as the 'db', 'dc', 'dq' commands. I try to implement it hopefully this weekend.
 -
-
 Please let me know, if you need any special functionalities (arguments) to this command, so I can implement it too.
 -
-
-
-
-
-
-
-
-
-
-
-
 This is great idea. 👍
 -
what are you doing 🤔
-
 It basically injects breakpoints into the guest, using an script function. Read this article for more details: https://rayanfam.com/topics/hypervisor-from-scratch-part-8/#event-injectionHypervisor From Scratch – Part 8: How To Do Magic With Hypervisor!
We write about Windows Internals, Hypervisors, Linux, and Networks.
-
too insane 😅 i don't even know what it is
-
Joined.
- 26 August 2023 (2 messages)
-
 @HughEverett I'll run a test with the COM port again tommorow. I've had an issue with crashing applications due to high turbo boosting on my intel cpu that my cooling was unable to handle, leading to numerous processes hanging and crashing. Perhaps it also corrupted the stream of data.
 -
 Sounds good 👍
 - 27 August 2023 (1 messages)
-

- 28 August 2023 (14 messages)
-
Joined.
-
Hello guys, im a little confused about usermode debugging in Debugger mode and was hoping someone could help clarify a few things for me.
-
I noticed .attach is not usable, is using, r cr3 = DirBase the same as doing .attach?
-
 Hi,
Hi,
You have plenty of options,
1) You can use HyperDbg in Debugger Mode (Using VMWare Workstation Player) and attach to the target process using the '.process' or the '.thread'.
2) You can write an event for the target process and perform the modification in the target process memory layout:
!syscall pid xxxx script { @cr3 = 0xYourDirBase; } -
Also is there any way for me to use usermode symbols to set breakpoints, for example bp user32!CreateProcessA
-
 The breakpoints is only available on the Debugger Mode (not VMI Mode). But, still you can hook, modify, whatever in VMI Mode.
Like,
!epthook user32!CreateProcessA pid xxxxx script {
// Your script to modify memory, registers, log whatever.
} -
 You have to just make sure that the symbols of target process is loaded (specially in WoW64 processes).
.sym reload pid xxxxx -
Gotcha, thanks for the help!
-
oh one more question, is there anyway to look up a process pid by name?
-
 It's always recommended to use a virtual machine in Debugger Mode as either a fault in HyperDbg, or any wrong modification might BSOD your physical system.
Please take a look at:
https://docs.hyperdbg.org/getting-started/attach-to-hyperdbg/debugAttach to a remote machineRemote debugging in VMI Mode and Debugger Mode
-
 You can use the '.process list' and after that, use a text editor to search it.
 -
-
Joined.
-
hi, is there any example for SDK in C++ ?
- 29 August 2023 (14 messages)
-
Joined.
-
 There is no guide of how to use SDK yet, but there are two simple project "just load hypervisor" as "hprdbgrev" for the user-mode and "hprdbgrm" for kernel-mode in the main repo. You can use them.
 -
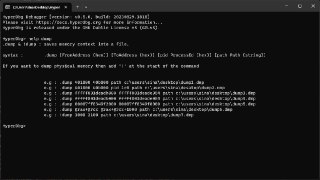
 @ricnar The '.dump' command is added. It's now available in the 'dev' branch.
 -
-
-

-
-
-
-
-
 anyone know good hyperv can bypass ring0 anticheat ?
 -

-
 you know hyperv/efi dev
 -
 can make read/write for ring0 process
 - 30 August 2023 (38 messages)
-
hi, dose anyone have the problem of patching instructions to nops using eip 90 90 ?
-
after i try to patch user process's instruction to nops, hyperdbg gets stuck and cannot ctrl+c to interrupt
-
the version is release 5.0
-
 Hi, what command did you use?
 -
eb eip 90 90
-
 Are you using hyperdbg in debygger mode?
 -
 What is the signature of HyperDbg? kHyperDbg?
 -
Vmi mode or remote kernel debug mode
-
I will check.signature later
-
 VMI Mode? 🤨
 -
😂 forget exact name
-
 😅😅😅
😅😅😅
No, I mean it doesn't make sense to change @eip in the VMI Mode. -
 VMI Mode is the equivalent of Local Kernel Debugging in WinDbg.
 -
 In VMI Mode, registers are all considered as zero.
 -
 So, the RIP or EIP makes sense in context of thread. While you are local debugging, changing the memory based on registers doesn't make sense.
 -
 As you're not changing anything special.
 -
Sry it is debugger mode
-
I just checked the document
-
I want to patch user mode process instructions to nop
-
 How did you attach to the target process?
 -
Epthook to syscall to attach target process
-
 Are you using VMware Workstation?
 -
Yes
-
Pro 16
-
 You want to patch a system-call?
 -
No
-
User.mod instructions
-
 So, you used an '!epthook' and once it's triggered, you want to patch the current running instruction? Am I right? I also assume that you didn't use the '!syscall' for this purpose.
 -
I recap what I have done. I use epthook to ntprotectvirtualmemory in kernel to attach a target process, and then bp the return address in user-mode to return back to user-mode, and then use eb @eip 90 to patch instructions to nop
-
 Got it. I will check it tomorrow.
 -
I just realized , "eb 0x123456 90" works properly. "eb @eip 90" doesn't work
-
 So what if you use the 'r @eip', and after that, use the value of @eip as a constant address and modify it?
 -
 Like,
Like,
kHyperDbg> r eip
rip=0xfff12345
And then:
kHyperDbg> eb 0xfff12345 90 90 -
!epthook ntprotectvirtualmemory script {
if(dq(@r8) == 21000){
printf("Process name: %s\n", $pname);
printf("PID: %x\n", $pid);
pause();
}
}
,and then
bp 0x12345678
eb @eip 90 90
t -
hyperdbg gets stuck and cannot use ctrl + c to interrupt
-
!epthook ntprotectvirtualmemory script {
if(dq(@r8) == 21000){
printf("Process name: %s\n", $pname);
printf("PID: %x\n", $pid);
pause();
}
}
,and then
eb 0x12345678 90 eb fd
g
this work properly -
 What is '0x12345678' ? Is it a random address?
 -
that is user-mode process memory address
- 02 Aug 2023 (31)
- 03 Aug 2023 (17)
- 04 Aug 2023 (50)
- 06 Aug 2023 (50)
- 07 Aug 2023 (123)
- 08 Aug 2023 (21)
- 09 Aug 2023 (186)
- 10 Aug 2023 (1)
- 12 Aug 2023 (3)
- 13 Aug 2023 (4)
- 15 Aug 2023 (1)
- 18 Aug 2023 (1)
- 21 Aug 2023 (165)
- 22 Aug 2023 (35)
- 26 Aug 2023 (2)
- 27 Aug 2023 (1)
- 28 Aug 2023 (14)
- 29 Aug 2023 (14)
- 30 Aug 2023 (38)
