- 01 July 2023 (23 messages)
-
 Joined.
 -
 Joined.
 -
 Hey anyone can write bypass for anticheat (read/write) like hypervisor
 -
 Hey,
Hey,
You can easily use HyperDbg along with short-circuiting commands. -
 Do you know where you want to bypass read/writes? I mean the exact address.
 -
 Ya its like game offset
 -
 But not would like use direclty hyperdbg,
 -
 Windows Hypervisor Development | Bypass Anti-Cheats
This YouTube video is ONLY for educational purposes. Only make game cheats on your own games that you have made or have explicit permission to cheat on. Do not break TOS of the software you use your Hypervisor knowledge on. I am not responsible for any of your actions. In this video you will be introduced to the concept of Hypervisors. They are used in Virtual Machines, and you will be able to create your own thus allowing you FULL control over the system. This series will lead deeper into the topic eventually bypassing Anti-Hypervisor detections. If you enjoyed this video or have any questions please comment below! This is a new series and I will continue if you request. Prerequisites: 3 years of game cheat knowledge. Good understanding of C++, C, and x64 Assembly. Knowledge of Windows internals such as NT API, Win32 API, Handles, Threads, Processes. Patience and lots of reading intel manual. Series: https://rayanfam.com/topics/hypervisor-from-scratch-part-1/
-
 Have see this in youtube
 -

-
 Have ask founder he say me lot of anticheat enthusiasts
 -
 Generally, in HyperDbg you need to use !monitor
https://docs.hyperdbg.org/commands/extension-commands/monitor
and use short-circuiting:
https://docs.hyperdbg.org/tips-and-tricks/misc/event-short-circuiting!monitor (monitor read/write/execute to a range of memory)Description of the '!monitor' command in HyperDbg.
-
 No, this is not allowed btw.
 -
 Lol
Lol -
 If you want to do it, by HyperDbg, you can do it with short-circuting.
 -
 What’s happening
 -
 We got some cheaters here
 -

-
 This link is Hypervisor From Scratch. HyperDbg is an extension to this hypervisor. The code base is the same.
 -
 Exactly
 -
 Guys, do not try to hire anyone in the group please.
 -
 Its not allowed?
 -
 nah this chat is for hyperdbg related stuff, go look somewhere else
 - 02 July 2023 (9 messages)
-
Hyperdbg instalacion y primeros pasos (Hyperdbg installation and first steps)
HyperDbg Debugger es un depurador de Windows de código abierto, impulsado por la comunidad, asistido por hipervisor, en modo usuario y en modo kernel que se centra en el uso de tecnologías de hardware modernas. HyperDbg viene con funciones como hooks ocultos, que son tan rápidos como los viejos hooks inline, pero también sigilosos. Imita los hardware debug breakpoints para (lectura y escritura) en una ubicación específica, pero esta vez completamente invisible tanto para el kernel de Windows como para los programas y, por supuesto, ¡sin ninguna limitación en tamaño o cantidad! El uso de la división de TLB y las características como la medición de la cobertura del código y la supervisión de todos los movimientos hacia/desde la memoria mediante una función hacen de HyperDbg un depurador único. Aunque tiene características novedosas, HyperDbg intenta ser lo más sigiloso posible. No utiliza ninguna API de depuración para depurar Windows ni ninguna aplicación, por lo que los métodos antidepuración clásicos no lo detectarán. Además, resiste la explotación de los métodos delta de tiempo (p. ej., RDTSC/RDTSCP) para detectar la presencia de hipervisores, lo que dificulta mucho que las aplicaciones, los empaquetadores, los protectores, el malware, los motores antitrampa, etc., descubran el depurador. https://github.com/HyperDbg/HyperDbg/releases
-
-
 Wow, it's great. 👍
 -
 Joined.
 -
 Joined.
 -
-
-
-
- 03 July 2023 (238 messages)
-
 Hi,
Hi,
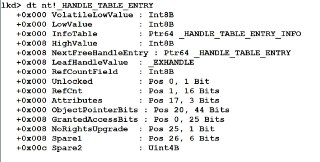
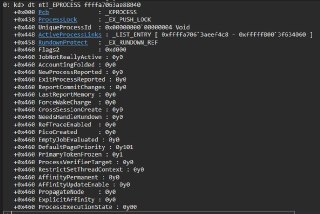
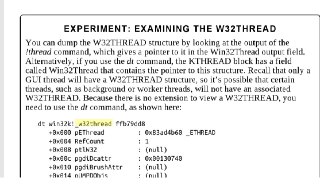
The 'dt' command is supported, but what do you mean by 'documented structure'? Do you mean the structures in WDK, SDK? 🤨
https://docs.hyperdbg.org/commands/debugging-commands/dtdt (display and map virtual memory to structures)Description of the 'dt' command in HyperDbg.
-
-
-
 Nah, he means like the structures from PDB
 -
-

-
 🤨🤨
🤨🤨 -
 Still didn't get the point. Can you give me an example? Does Windbg load it from PDBs?
 -
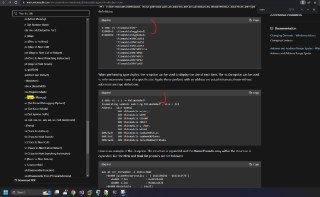
 Yea, it loads symbols from PDB and lets you search for the type you need and display it
 -
 dt (Display Type) - Windows drivers
The dt command displays information about a local variable, global variable or data type. This can display information about simple data types, as well as structures and unions.
-
 You mean '-y'?
 -
-
 By using '-y SthToSearch' option?
 -
 I didn't mean any option, just the command in general
 -

-

-

-

-
-
-

-
 ^^
^^ -
-
-

-
-
-

-
-
 yep, '-r' is not supported, but generally it shouldn't be hard. I'll add it to the todo-list.
 -
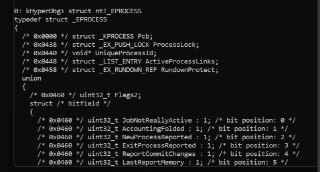
 Also, make sure to check the 'struct' command. @ricnar @invlpg
https://docs.hyperdbg.org/commands/debugging-commands/structstruct (make structures, enums, data types from symbols)Description of the 'struct' command in HyperDbg.
-
 Perfect, tysm
 -
-
 This command is the integration of 'pdbex' by Petr Benes into the HyperDbg and it combines HyperDbg's symbol server to be a C compileable structure generator.
 -
-
 Sure. I'll try to add it ASAP. Additionally, since HyperDbg is an open-source project, feel free to open pull requests on GitHub and contribute any interesting findings or additions you come across.
 -
good to export the structure to ida
-
-
-
 The credits for this command all goes to my friend, Petr.
 -
-
-
 It's perfectly okay.
 -
-
-
-
 😅😅😅
😅😅😅 -
 you're a legend.
 -
-
-
-
-
-
-
-
-
-
 Isn't it same as the 'k' command?
 -
-
-
 k, kd, kq (display stack backtrace)
Description of 'k, kd, kq' commands in HyperDbg.
-
 Yes
Yes -
-

-
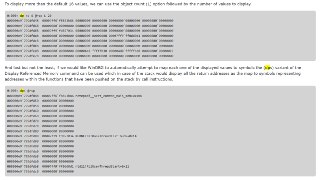
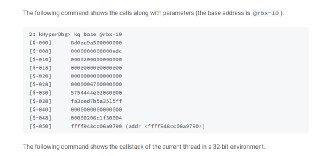
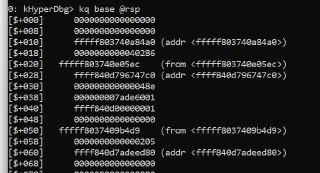
 You can specify the 'base' for the 'k' command.
 -
-
-
-
-
-
-
 That would be easy to add.
 -
 I'll add it.
 -
-
-
 https://docs.hyperdbg.org/commands/debugging-commands/k#parameters
The 'k' command also gets the size as 'l'.k, kd, kq (display stack backtrace)Description of 'k, kd, kq' commands in HyperDbg.
-
-
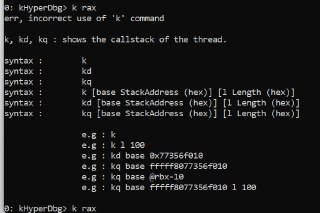
 kq base @rax
 -
-
 or in 32-bit pointers:
kd base @eax -
-
 is @rax a valid pointer?
 -
-
-
-
 the base should be a valid (and safe) address.
 -
-
 So, this error is supposed to be displayed. Yeah?
 -
 Agree.
 -
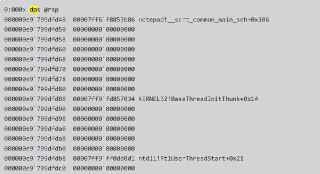
 I'll try to add 'dps' for the next version.
 -
-
-
-
-
-
-
-
-
-
-
-
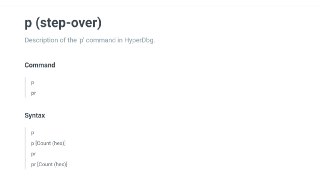
 Some command are just repeating in HyperDbg. Like 't'.
 -
 Just press 'enter' after running one 't'.
 -
 It continues to run the previous command.
 -
-
-
 Please check this one:
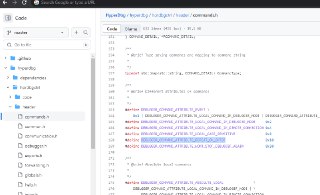
https://github.com/HyperDbg/HyperDbg/blob/master/hyperdbg/hprdbgctrl/header/commands.hHyperDbg/hyperdbg/hprdbgctrl/header/commands.h at master · HyperDbg/HyperDbgState-of-the-art native debugging tool. Contribute to HyperDbg/HyperDbg development by creating an account on GitHub.
-
 Those commands that have this attribute (DEBUGGER_COMMAND_ATTRIBUTE_REPEAT_ON_ENTER), will be repeated after pressing 'enter'.
 -
 This is one of the hidden features of HyperDbg that I never told anyone about it. 😁
 -
 i quickly looked on it and it seems that we'd have to implement this stuff in pdbex first, i'll see what can be done
 -
 No, as long as I know, pdbex already supports it.
 -

-

-
 The only thing that needs to be supported is in HyperDbg side, where we have to derefrence and query memory multiple times to show the pointers recursively.
 -
 Or, maybe I'm wrong, is it even necessary to dereference pointers? Or should we just show the structure that are embedded into other structures (not pointers)?
 -
 well, if we want to replicate 1:1 windbg's dt -r option then yea we should
 -
 So, we need to query the memory multiple times to show it.
 -

-
 Oh yeah, you are right. Neat
 -

-
 Kinda agree, but honestly I believe there is a concern regarding user privacy here. Someone might not want to set it to default.
 -

-
 It's saved. All the setting and symbol path is saved.
 -

-

-

-

-

-
 What do you mean?
 -
 No, it should be applied, otherwise, it's a bug.
 -

-
-
 😳
😳 -
-
-
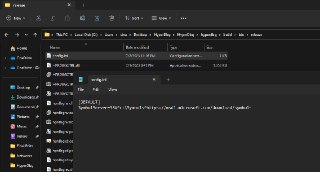
 What do you mean? Once you set the symbol path, one file 'config.ini' should be created there beside the exe file.
 -
 yeah that's what happened to me too
 -

-
 As long as that ini file is there, HyperDbg uses that file. But if you remove that file (recompile & clean everything), then you should set it again.
 -
 Isn't it like this?
 -

-
 yeah, there isn't any bug in HyperDbg. Being HyperDbg and having bugs is a contradiction itself. How could a debugger have a bug? Not possible. 🙂😅😁
 -

-
-
-
-
-
-
-
-
-
-
-
 What if the the target COMx port is different in the target machine? It happens to me a lot, where COM2 is not valid and I used COM1. How can we verify the correct COM port?
 -
-
-
-
-
-
 isn't it better to handle it with some 'alias'ing commands?
 -
-
-
-
-
-
 for example, one might create an alias (called 'alias1'), let say ' .debug prepare serial 115200 com2'. After that, whenever the use types 'alias1', the same command will be executed. What do you think of it?
 -
-
-
-
 yes.
yes. -
-
 and aliases will be saved into the config file.
 -
-
-
 I'll add it to the todo list.
 -
-
-
 No, that's pretty okay. You feedback are really valuable.
 -
 Currently, I spent a entire week on fixing the '.start' command. Still no chance. 😞
 -
-
-
-
 I test tens of variants, intercepting #PF page-faults, setting EPT changed breakpoints on read/write. Setting regular OS paging bits. All of them failed.
 -
-
-
 This is not working anymore, specially in the latest version of Windows.
 -
 It might work but sometime, we might not win the race.
 -
-
 So, it's not stable. We have to find an alternative way.
 -
-
-
 Yeah, it works for me too. But I think if you keep testing it and running it, it might fail at some points.
 -
 I mean repeatedly testing it.
 -
-
-
 The problem here is, once the system wants to execute the target entrypoint, the address is not available on the RAM. Thus, it has to throw a #PF page-fault and brings the page in.
 -
 Sure we could intercept the page-fault, but there is no PFN (page frame number) available in the #PF handler. Thus, the physical address is unknown and we could not use EPT to intercept it.
 -
 For some unknown reasons, Debug Registers (which work with Virtual Addresses) won't work either.
 -
 And regular OS page table bits are also not usable. Because the entrypoint will be accessed several time by some functions in ntdll.
 -
-
 I could fix it by using MBEC (mode based execution controls), but MBEC is quite a new feature in Intel processors. Thus, if I implement it like this, we won't support the '.start' command on Skylake (6 gen Intel) and older processors anymore.
 -
 Still, we could use Windows APIs to notify us about the entrypoint, but that's not the case. We need to have an API (Debug) independent starting mechanism in HyperDbg.
 -
-
-
-
-
-
-
-
 You got it right but the thing is, it's technically impossible to implement a guaranteed step-over. Because we're not sure what a function wants to do.
 -
-
 Imagine this scenario, you want to step-over a function that tries to write into a file.
 -
-
 Based on the implementation, we masked the external interrupts to make this instrumentation step-in possible. No, what happens if a SYSCALL execute in the state when interrupts are masked?
 -
 It breaks the system.
 -
-
-
-
 The details of the implementation is described here: https://research.hyperdbg.org/assets/documents/kernel-debugger-design-1st-edition.pdf
it might help knowing about some of the technical difficulties regarding this 'instrumentation step-in'. -
 I didn't get the point. Why do you use one core?
 -
 I mean once HyperDbg continues the system (e.g, pressing 'g', or 't') then all other processes might (and will) get the chance to run in the system.
 -
-
-
 yeah, agree. It's really hard to handle multi cores with different TLBs, EPTPs, CR3s, etc.
 -
-
-
-
 Yeah, and also please consider this: In HyperDbg, we won't ignore the interrupts. We just save them somewhere in the memory and once the guest continues (we config VMCS to VM-exit on Interrupt Window Exiting events). So, after we continue HyperDbg from the 'i' command, it immediately re-injects the previous interrupts. Thus, a context-switch will happen right after continuing the core from an instrumented step-in.
 -
-
-
-
-
-
-
 This is exactly a part of the new project (new version), that we currently working on it. Starting from the next (major) release, 2 new events will be added to HyperDbg. One to detect execution (and mode change from kernel-mode to user mode), and getting events of memory (read/write/exec) on the context of the entire system. So, this feature will be included in the next major release.
 -
 Honestly, I already implemented these things in the code base. But, didn't export it as events yet. There multiple other events like !crwrite (control register write) detection which is not yet documented, but implemented.
 -
 The problem here is interrupts. For example, the '.start' which is an essential command, works perfectly up until now. Suddenly it starts being buggy and I have to spend weeks to find a solution for it. That's why we're a little bit behind the scheduled plan.
 -
- 04 July 2023 (6 messages)
-

-
 @ricnar
Just a simple reminder, there is no need to run HyperDbg as administrator in the host. Only the guest needs administrator privilege because it needs to install the driver but the host doesn't need administrator permission (elevated token). -
-
Perfect
-
-
 Yes, HyperDbg can be used for fuzzing, but we didn't release anything for the fuzzing in the debugger.
 - 05 July 2023 (110 messages)
-
 Hey, I've set up remote debugging over COM, and my debugger seems to be having a spam of err, invalid packet received
 -
 the debugee doesn't seem to throw any errors
 -

-
 remote vmi seems to work fine
 -
 but debugger mode just enters a 10s spam of invalid packets, with the system destabilized during the time
 -
 it seems to "fix up" after a while, but debugger isn't able to process any commands..
 -
 If it matters at all, debugee is running win10 22h2, all bins signed and debugger is on win11.
 -
 Hi,
Hi,
Over physical serial cable? Or named pipe VM? -
 Physical.
 -
 RS232 from debugee, and USB on debugger
 -
 Yeah, this is a problem that was previously mentioned in issue in GitHub but I don't have a physical serial cable (and port) to test it now. Is there any error message or something there?
 -
 Nope, just an invalid packet received spam in debugger.
 -
 No errors on debugee
 -
 I’ll check again, perhaps burried somewhere in between
 -
 And what happens after that? BSOD?
 -
 no, it just lags the system for 10s and then just does nothing, system works fine
 -
 but no interaction available on debugger
 -
 🤔
🤔 -
 if it helps, I saw this happen during symbol sync
 -
 both ran as admin as well
 -
 No problems over TCP in VMI mode
 -
 I don't have any idea for this case. The best way is tracing the codes using Visual Studio debugger to see the faulty code.
 -
 Got it; will check once I can.
 -
 Please keep us informed if you find the problem or you understand anything about it.
 -
 Thanks 👍
 -
 @HughEverett How's the memory itnrospection extension going by the way?
 -
 This extension is called, "HyperDbg's reversing machine" which aims to automate reverse engineering tasks by using the hypervisor core. 2 or 3 new extension commands will be added and several applications. Right now it's under development.
 -
 very nice, finished work and will try to see what's up with physical com now hopefully
 -
 I'm sure you can find it.
 -
 Keep in mind, HyperDbg sends/receives packets in the following file:
https://github.com/HyperDbg/HyperDbg/blob/master/hyperdbg/hprdbgctrl/code/debugger/kernel-level/kernel-listening.cpp
Each packet starts with an actual indicator at the top which is checked here:
https://github.com/HyperDbg/HyperDbg/blob/a571781e8651998b982a9f53edf8f3d3501a6b2e/hyperdbg/hprdbgctrl/code/debugger/kernel-level/kernel-listening.cpp#L133
First, try to figure out whether you receive the correct data from the debuggee (using tracing facilities in VS debugger), after that you should check whether the communication is okay or erroneous.HyperDbg/hyperdbg/hprdbgctrl/code/debugger/kernel-level/kernel-listening.cpp at master · HyperDbg/HyperDbgState-of-the-art native debugging tool. Contribute to HyperDbg/HyperDbg development by creating an account on GitHub.
-
 Well just looking at the code, wrong indicator is passed. I'll check whether the packet is corrupted for some reason?
 -
 🤨🤨
🤨🤨 -
 poking around the hv itself will be fun ig..
 -
 The sender is not sending the correct indicator or it's a receiver error?
 -
 I'll check in debug.
 -
 Just tracing the comms calls rn
 -
 Also, using other serial listening tools like putty, XCTU, etc. (maybe changing baudrate) might be helpful to see the actual packet that is received.
 -
 well, I could also just build in debug and check the packet header..
 -
 I think the issue lies in symbol packets having an invalid header
 -
 just have to install wdk on laptop..
 -
 (also possibly why it wasn't noticed- if debugger already has all the symbols, then i think nothing would be received?)
 -
 I'll have to check out sync logic on that, but I'll just try this wild guess first.
 -
 Symbols of what?
 -
 🤨🤨🤨
🤨🤨🤨 -
 of modules
 -
 'synchronizing modules symbol details'
 -
 -> this is right where the invalid packet spam starts hitting
 -
 🤔🤔🤔
🤔🤔🤔 -
 important things to note:
initialization packets are fine, posts "synchronization" successful packet also sends fine, but debugger is essentially frozen -
 So, just try to comment those lines to see whether it works or not without symbols.
 -
 yeah just waiting on the wdk download..
 -
 Oh also, while I've got you on line, if we were to log reads on a specific address is there a prettier way to print the violator? (i.e. module_name.sys+rva instead of 0xffffff33331123)
 -
 via the script
 -
 Just trying to beautify the logging somewhat, without having to manually edit values for base addresses within scripts as sometimes I'm restricted to only a few minutes of debugging before anti-dbg/anti-hv capabilities kick in :)
 -
 Would also nicely show foreign kernel memory (i.e. unsigned/mapped), like PG, interacting with certain structures
 -
 since it'd have to fall back to phys address log
 -
 I guess this is all possible with the C++ SDK..
 -
 Do you want to translate addresses (from symbols) to function names+rva? Am I get it right?
 -
 Just image names + rva
 -
 No symbols.
 -
 I don't want ntoskrnl->ExAllocatePool, just ntoskrnl.exe+0x14456 is enough
 -
 because the images I want to dig around in don't have symbols anyway.
 -
 -> this is all in KM
 -
 A clear example would be a read monitor on ntoskrnl!PsLoadedModuleList
 -
 I'm looking to print PG, and foreign driver memory accesses to this structure.
 -
 It's kinda hard. Because symbols and module names are all in user-mode. This information is not available in the kernel as the kernel directly communicates with the debugger without any help from user-mode.
 -
 But, I'm thinking of a simple way of handling this. Maybe you can change the printf function of the script engine and add these details to it manually.
 -
 I guess so, will have to add a parser for some of the stuff myself ig
 -
 Problem comes with newly loaded images though- I'd need to place a hook at the end of MmLoadSystemImageEx, to update the module list again with a new driver loaded.
 -
 well, not really a problem, just complicates things
 -
 (i know I can retrieve it when the memory is touched, but if it's touched frequently, caching is more.. appropriate)
 -
 Or I could just loop over PsLoadedModuleList, check the address range and print the module name directly from the struct...
 -
 yeah that could work nicely
 -
 look ups iffy but at least it doesn't need another hook
 -
 unfortunate that this is too complicated for the script engine..
 -
 Yes, I think the best way is to modify the script functions manually.
 -
 Exactly.
 -
 but if I get it to some usable state, perhaps I can push some debugger options for this :)
 -
 But I think the kernel mode event triggering is pretty straightforward. You can easily add your codes there. I think it's the 'Dispatch.c' where HyperDbg triggers all the events.
 -
 yeah, packet is malformed, indicator, typeofthepacket is wrong
 -
 then it hangs at WaitForSingleObject (line: 1297 file: ctrl\code\debugger\kernel-level\kd.cpp
 -
 I think the malformed packets might be something else, and that it's all good?
 -
 it keeps waiting for another packet
 -
 am I supposed to use some other interface to interact with the debugee?
 -
 So, you mean at first, packet are received correctly but after sometimes, the debuggee sends malformed packets?
 -
 Can you confirm that some packets are received correctly?
 -
 Yes
Yes -
 the weird part is; if i break
 -
 there isn't really any "spam"
 -
 just 2x invalid packet received
 -
 and it's waiting for another packet to be received
 -
 Is it only for a specific type of packet?
 -
 Or randomly starts submitting invalid packets?
 -
 Random invalids.
 -
 I don't understand why it's waiting for a new packet though.
 -
 let me check what's happening on the debugee lol
 -
 Once a packet is received incorrectly, it just ignores the packet and waits for another packet.
 -
 interesting, attaching onto the ctrl on debugee freezes system..
 -
 Yeah but at what state am I able to do anything as in debugging lol
 -
 Can you comment those lines that send the symbols data (in debugge)?
 -
 yep, checking the actual packet control flow atm
 -
 looks fine..
 -
 will try commenting
 -
 also tried forcing a break in debugee, but that just led to a watchdog bsod unfortunately
 -
 I'm feeling pretty sleepy right now. I'll be back to check it with you tomorrow.
 -
 😴
😴 -
 sure, thanks for the help
 -
 if I manage to get it working I'll throw a message onto the gh issue and here with the fix
 -
 — hopefully without breaking some components in the process :)
 -
 welp, not related to symbols lmao
 - 06 July 2023 (295 messages)
-
 In case, anyone is interested in contributing or adding new things to HyperDbg, here I made a project source tree overview.
The original image is available here:
https://github.com/HyperDbg/graphics/tree/master/Diagrams/source-treegraphics/Diagrams/source-tree at master · HyperDbg/graphicsGraphics and Art Boards of HyperDbg. Contribute to HyperDbg/graphics development by creating an account on GitHub.
-

-

-
-
-
-
-
-
 Hi,
Hi,
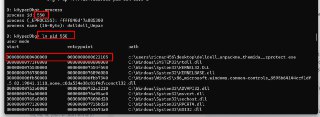
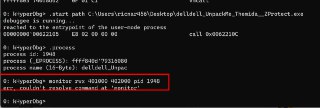
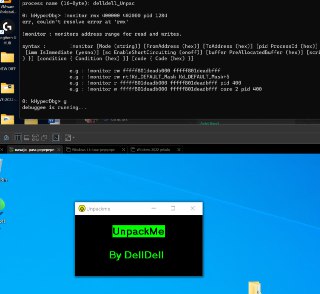
You can add 'pid' to the !monitor command, so the hook will be applied into the target process memory layout.
Like,
!monitor rwx Addr1 Addr2 pid 1234 -
-
-
-
 What was the error? 🤔
 -
 No difference
 -
-
 !monitor
 -
-
-
 rw is only supported. This command is not supporting 'rwx' currently.
 -
 Are you sure that the address is valid in the target process?
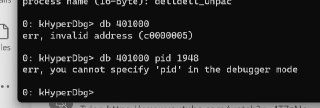
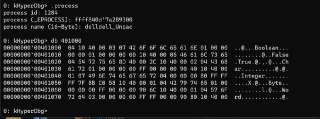
Please try:
db 401000 pid 1948 -
 Also , is the process id in hex format?
 -
-
-
-
-
-
-
-
-
 Let me see.
 -
-
-
-
-
-
-
 Yes, please send it here.
 -
-
-
-
 Okay, I'll test it now.
 -
-
-
-
-
 This error should be easy to investigate. I'll check it now.
 -
-
-
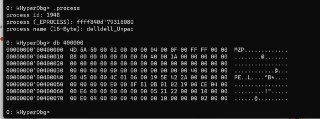
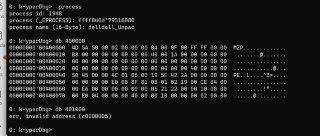
 Address is wrong in the command
 -
 It's 400000
 -
 Should be 400 000 but you specified 40 000.
 -
-
-
 Oh, yes, you're right.
 -
-
-
-
 Because it's not loaded yet. Am I right?
 -
-
-
-
-
-
 Can you use this?
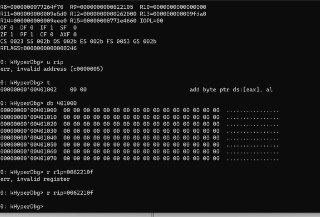
!va2pa 401000 pid 1948 -
-
-
-
-
-
-
 You know what happened here? 😅
 -
-
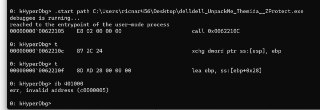
 Windows won't load anything to RAM until at least one instruction is executed from the target address.
 -
-
-
 So, it's not executed yet thus, there is not PFN allocated for this address.
 -
-
 Once, one instruction is executed for it, the address will be valid.
 -
-
-
 The header is accessed at least one time during the PE loading
 -
-
-
 So, a #pf page fault happens and bring it to the RAM.
 -
 Can you trace instructions to execute one instruction in the target address?
 -
-
-
-
-
-
-
-
-
-
-
-
-
 There is a clever solution for this.
 -
-
-
 😁😁
😁😁 -
 Is the problem solved now?
 -
-
-
 What's the problem right now?
 -
-
-
 Okay, there is another solution for that.
 -
 Let me explain it.
 -
 We have to intercept the page-fault for it.
 -
 For example,
 -
-
-
 !exception pid 1484 script {
if(@cr2 > 401000 && @cr2 < 402000)
{
pause();
}
}
- 01 Jul 2023 (23)
- 02 Jul 2023 (9)
- 03 Jul 2023 (238)
- 04 Jul 2023 (6)
- 05 Jul 2023 (110)
- 06 Jul 2023 (295)
- 07 Jul 2023 (141)
- 08 Jul 2023 (6)
- 09 Jul 2023 (1)
- 10 Jul 2023 (225)
- 11 Jul 2023 (164)
- 12 Jul 2023 (48)
- 13 Jul 2023 (114)
- 14 Jul 2023 (14)
- 15 Jul 2023 (31)
- 16 Jul 2023 (34)
- 17 Jul 2023 (6)
- 18 Jul 2023 (17)
- 19 Jul 2023 (22)
- 20 Jul 2023 (10)
- 21 Jul 2023 (2)
- 22 Jul 2023 (14)
- 23 Jul 2023 (121)
- 24 Jul 2023 (43)
- 25 Jul 2023 (5)
- 26 Jul 2023 (29)
- 27 Jul 2023 (19)
- 28 Jul 2023 (1)
- 29 Jul 2023 (7)
- 30 Jul 2023 (396)
- 31 Jul 2023 (64)
