- 10 July 2023 (225 messages)
-
-
 💪
💪 -
-
-
-
-
-
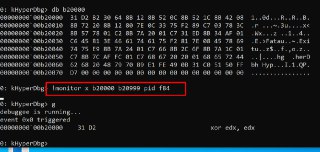
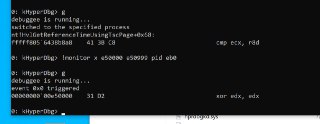
 You have to specify both 'x' and 'w' for this purpose.
 -
 !monitor xw AddrFrom AddrTo script { ... }
 -
-
-
-
-
-
-
-
-
-
-
-
-
-
-
-
-
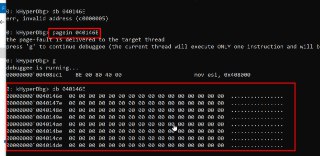
 You can check whether it's paged or not by using '!pte' or '!va2pa' command.
 -
 Sure.
Sure. -
-
 👍
👍 -
-
-
-
-
 So, the 'db' is still problematic?
 -
-
-
 👍
👍 -
-
-
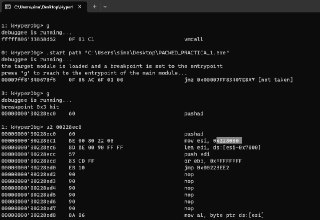
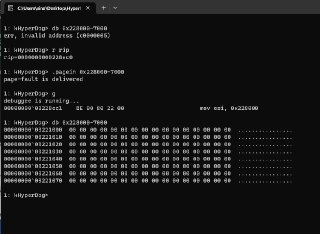
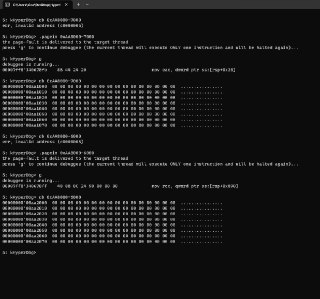
 Even when I add the '.pagein' command, we still need another command to spin (halt) the target process.
 -
 I have some ideas for this as well.
 -
-
-
 And this command is needed because of the fundamental design issue of not applying events immediately.
 -
 😅
😅 -
-
-
 Thanks for putting time testing it. 🙏
 -
 @HughEverett Hey, could I sponsor you a motherboard with a COM port? :D
 -
 I'm still completely lost on this issue
 -
 Issue is somewhere in ReadIrpBasedBuffer, that's the furthest I can get by checking the debugee process
 -
 since I can't attach a debugger to it
 -
 or whole system freezes
 -
 also confirmed not working on last dev branch commit
 - 11 July 2023 (164 messages)
-
 Regarding COM port issue:
- Fails at first packet:
Checksum mismatch
0x84 SENT FROM DEBUGEE
0x54 CALCULATED ON DEBUGGER -
-
 Aha, okay. That should be the problem. I'm not that much familiar with serial programming, but do we need to implement a handshaking mechanism for the packets? I mean is it common these days that some packets fail to be received due to the physical problems?
 -
 I have to order a PCIe serial card to test it.
 -
-
-
-
-
-
 Also, I worked on the '.pagein' today. But, I think I have to read Intel manual (SDM) to figure out some of the Error Codes that are valid for #PFs. So, I need more time to finish the '.pagein' command as it's a little bit tricky.
 -
-
-
-
-
-
-
-
-
-
-
One thing that I realized is that if the target is waiting for a console entry in the same CMD of the hyperdbg, if you do ctrl -C and you want to change the context it doesn't work, you do .process pid xxx and G and it doesn't return because the CMD remains waiting for the entry of a key of that program
-
-
-
-
 This is a really hard to fix issue. Because, how we can detect it's execution? Windows just won't context switch to the process that is waiting.
 -
 Can explain it more?
 -
-
-
 oh, yes, I got what you mean.
 -
 You mean HyperDbg just creates the process inside HyperDbg-cli.exe
 -
-
 Yes, I noticed it too.
 -
 No, the execution is different.
 -
 Let me see, if I can fix it right now.
 -
-
 No, need that. Wait a minute, I'll fix it now.
 -
-
 No, of course not.
 -
 These things are easily solvable as all of them are Windows APIs
 -
 I have to figure out the flag that needs to be passed to the CreateProcess()
 -
-
-
 Fixed! Please 'pull' the last commit from the 'dev' branch.
 -
-
-
-
 No, it's a Win API fix. I just added CREATE_NEW_CONSOLE to the CreateProcessW's dwCreationFlags .
 -
-
 No, in hyperdbg/hprdbgctrl/code/debugger/user-level/ud.cpp
 -

-
-
-
-
-
-
-
-
-
-
-
-
-
 yes, it's not supported yet 🫣
 -
-
-
 No, of course not. Keep sending me feedbacks. 😎😎😎
 -
-
-
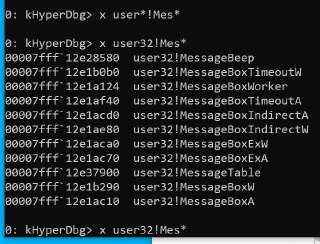
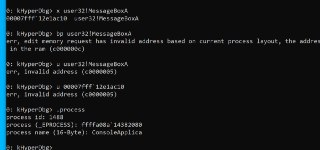
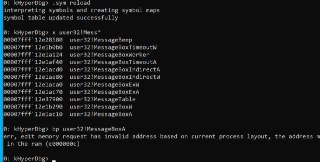
 What is the address?
 -
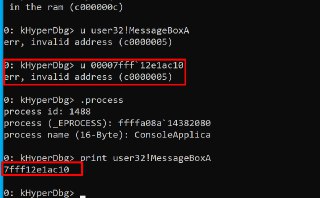
 u user32!MessageBoxA
 -
 isn't it available?
 -
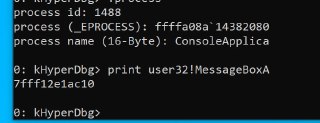
 or
or
print user32!MessageBoxA -
-
-
 Is it paged out?
 -
-
-
 no, that shouldn't happen.
 -
 Okay, maybe HyperDbg is loading the wrong base address?
 -
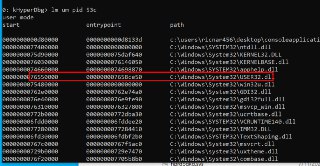
 can you verify whether the current process contains the user32 module? and get its address using 'lm um pid 1234'
 -
-
-
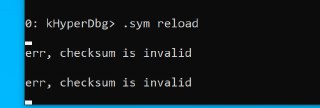
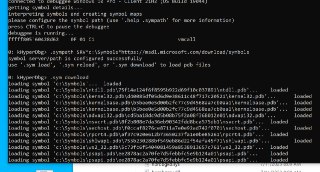
 Maybe reloading symbols? .sym reload?
 -
-
-
-
-
 .sym reload
 -
-
 When did you use this command? Immediately after running it?
 -
 Oops, something went wrong. Crashed. You need to restart that.
 -
-
-
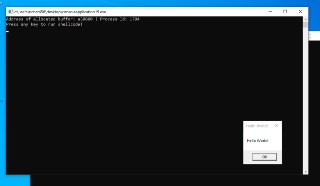
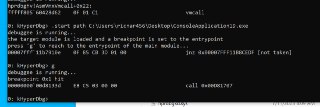
 Please make sure that once you access the 'user32!MessageBoxA', the address is loaded in the target module. Because I suspect (maybe) Windows didn't load that DLL into the process if you immediately access it.
 -
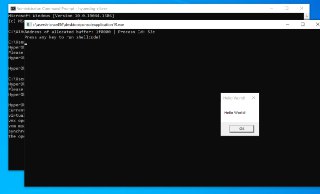
 But, if you run it and it showed 'Hello World!' then after that, it should be present.
 -
-
-
-
-
-
-
 Let me check it with x64dbg.
 -
 Are you trying to access the user32!MessageBoxA at the entrypoint?
 -
-
-
-
-
-
-
-
-
-
 So, is it still incorrect?
 -
-
-
-
-
-
 Can you read the modules list?
 -
 lm um pid 1234
 -
-

-
 I check the x64dbg and it seems Windows didn't change this yet. All process's user32 are mapped in the same address.
 -
-
 Ops, did you get it?
 -
-
 It interprets it as x64 bit.
 -
 While it's 32 bit.
 -
-
-
 Nice catch, thanks a lot for finding it.
 -
 This is a really hidden error, I've never think of it.
 -
 And it should be fixed immediately.
 -
-
 You're always helpful.
 -
 So, we can conclude that HyperDbg interprets user32 as a x64-bit module in a 32-bit module.
 -
-
 Let me create an issue for it in the GitHub.
 -
-
-
 Yes, that needs a fix from the code.
 -
 As I never reached to this error.
 -
 This was buried deep in the codes of HyperDbg,
 -
-
-
 no, we could easily manage that with the same x command.
 -
 The should not be a hard to solve problem.
 -
-
 yes
yes -
-
-
 exactly
 -
-
 Problem with interpreting 32-bit modules in x64 processes · Issue #243 · HyperDbg/HyperDbg
HyperDbg treats 32-bit modules in the same way as 64-bit modules, meaning that symbols pertaining to 32-bit modules must be loaded independently.
-
-
-
-
-
 it should be wow64. I'll add that to the issue too.
 -
-
 TypeOfThePacket DEBUGGER_REMOTE_PACKET_TYPE_DEBUGGEE_TO_DEBUGGER
RequestedActionOfThepacket DEBUGGER_REMOTE_PACKET_REQUESTED_ACTION_ON_USER_MODE_PAUSE -
 also, you need a motherboard with a com serial port
 -
 a virtual (pcie) serial port will not work
 -
 ^ this is the first packet that debugger receives
 - 12 July 2023 (48 messages)
-
 No, why motherboard? Once I buy a PCI-e serial card, it should be fine.
 -
 that requires so much more work though
 -
 since you can't natively send to i/o ports
 -
 i asked about this already once
 -
 🤨🤨🤨
🤨🤨🤨 -
 you'd need to write a efi dxe driver, replace/install acpi dbg and dbg2 tables, etc
 -
 to even somewhat make this work
 -
 and this hasn't been done publicly before
 -
 You mean, something like this, isn't enough?
https://www.aliexpress.com/item/1005005154188493.html -
 not for debugging purposes
 -
 I thought that I can use this PCIe device to connect it to PCI and then use the same HyperDbg functionalities to send data out.
 -
 why? 🤔
 -
 welp, theoretically you can until there's a bp :)
 -
 I can use the kdnet windbg to handle breakpoints in HyperDbg.
 -
 In HyperDbg we pass the breakpoint to the same HOST_IDT of the Windows for the debugging of it.
 -
 That's why it's possible to intercept breakpoints in VMX-root mode using WinDbg. But, intercepting breakpoints in VMX non-root mode, needs additional considerations in HyperDbg. (e.g., avoid intercepting #BPs in exception bitmap VMCS)
 -
 the point, if i understood it correctly, is that with a pcie device you won't be able to send i/o to the guest during a system bp
 -
 Why? you mean that IN/OUT instructions on COM ports won't lead to sending/receiving data?
 -
 Is it handled through Memory Mapped I/O (MMIO)?
 -
 I don't know, that's what I've been told by people who tried/looked into it.
 -
 I'll gladly sponsor you a motherboard though
 -
 No need. I try to buy one.
 -
 But let's ask people to make sure what happens to the serial card.
 -
 We could support PCIe serial cards too.
 -
 If these cards are supporting only MMIO (not PMIO).
 -
 I think going through the PCIe internals would be fun.
 -
Joined.
-
-
-
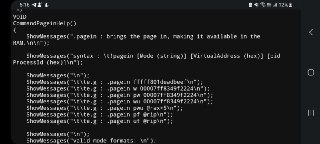
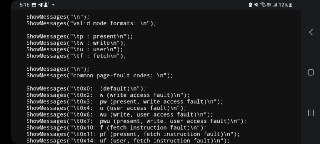
 Hi, yes, it's almsot done. I will finish it tomorrow. Here's the help of this command:
 -

-

-
 I intercepted all the page-fault exceptions on the system to find the valid error codes (page-fault code.). I believe the default behavior of this command (without parameter) should be injecting with the 'p' or present bit set, which indicates that some instructions try to read the target address and user can also change this behavior to 'w' (write) or 'f' (fetch) or 'u' (user access) or a combination of these page-fault codes.
 -
 However, one thing that is interesting for me and still unsolved is why sometimes the error code for the page-fault is zero? I couldn't find the reason what happens that lead to a page-fault with error code equal to zero. 🤔
 -
-
-
 Do you mean that we should add a range for it?
 -
-
-
-
-
-
-
 So, I'll add a 'size' argument to this command.
 -
 But, we have to make sure that a range of memory will need several page-faults to be delivered.
 -
-
 No, I still didn't work on that. Once the page-fault injection command is finished, I will get to that.
 -
- 13 July 2023 (114 messages)
-
 @HughEverett For the time-based attack evasion, do you also account for instructions that might be between the rdtsc & cpuid instructions?
 -
 any special instruction? or regular instructions?
 -
 both
both -
 entering fpu, avx/sse context switches..
 -
 or just regular instructions
 -
 I don't remember it, let me see.
 -
 as long as I see it in the source code, I think it can also bypass regular instructions but not sure about fpu, avx/sse instructions. 🤔
 -
 I'll give it a quick check
 -
 I didn't test this mechanism for years. It might cause instabilities on your system.
 -
 But, feel free to add new features and possible new detections to the transparent-mode. It's still one of the places in HyperDbg that needs lots of contributions.
 -

-
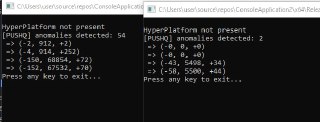
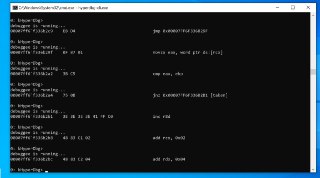
 looks good, but cpuid in between catches it
 -
 left is without hide right is with
 -
 long long a = __rdtsc();
_mm_lfence();
for (size_t i = 0; i != 64; i++)
{
__asm
{
addps xmm1, xmm0
addps xmm2, xmm1
addps xmm3, xmm2
addps xmm0, xmm3
cpuid
addps xmm1, xmm0
addps xmm2, xmm1
addps xmm3, xmm2
addps xmm0, xmm3
}
}
long long b = __rdtsc();
_mm_lfence(); -
 ran 1024 times, b - a stored
 -
 Is it working now?
 -
 The overall logic behind it is very simple. It can be manipulated here:
https://github.com/HyperDbg/HyperDbg/blob/a571781e8651998b982a9f53edf8f3d3501a6b2e/hyperdbg/hprdbghv/code/transparency/Transparency.cHyperDbg/hyperdbg/hprdbghv/code/transparency/Transparency.c at a571781e8651998b982a9f53edf8f3d3501a6b2e · HyperDbg/HyperDbgState-of-the-art native debugging tool. Contribute to HyperDbg/HyperDbg development by creating an account on GitHub.
-
 @ricnar Do you have any idea how we can implement this '.pagein' command for the VMI mode?
 -
 The problem here is, we never context switched to a new process in the VMI Mode. I'm sure we have to manage it with something like APC but, I'm not sure if that's a good idea. Because APCs are in APC_LEVEL IRQL which might cause problem for delivering the page-faults. 🤔
 -
-
-
-
-
-
-
 Probably, we need to be in the context of the target process. Because otherwise, we might break the operating system semantics. Writing on the other process means that we forced the cr3 to change to the target process and meanwhile, injecting #PF is wrong. Because, once the OS wants to handle the page-fault, it realizes that the current process details don't match with cr3 and probably lead to a BSOD.
 -
-
-
 Yes, in user-mode debugger it's handled transparently by the operating system. But as we're in halt the operating system in the hypervisor-level, we have to consider paging.
 -
-
-
 I'm gonna test attaching to the target process stack.
 -
 To see what happens.
 -
-
 yes.
yes. -
-
 That's why !pte or !va2pa won't support the 'pid' argument.
 -
-
-
-
 I'm thinking about intercepting the clock-interrupt in the target process, and once we're in the context of target process, we could inject it.
 -
 But, the thing about this method is, we're not sure whether the context of the process once we intercept it, is in the kernel-mode or the user-mode. So, it's like the user tries to inject a page-fault from the kernel-mode but the context of the process is in the user-mode. Thus, Windows interprets it as an attempt to read a kernel address from a user-mode process and delivers an exception to the SEH handler of the process which might lead to crashing the target process.
 -
-
-
 Joined.
 -
 @ricnar would you please send your packed file again?
 -
 I'm gonna test the .pagein now.
 -
 And also, send the expected address to bring it in.
 -
-
-
 💪💪👌
💪💪👌 -
 Do you have any idea about the expected address? I remember you told me you knew the section address which was an static address. 🧐
 -
-
-
-
-
-
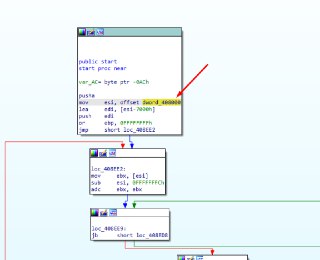
 So, you mean the address that is expected to be paged-in is 408000?
 -
 Oh, yes
 -
-
 I'll do that now.
 -
-
-
-
-
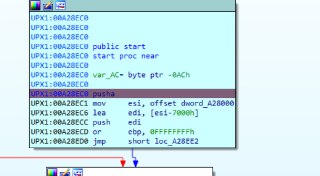
 -0x7000 from entrypoint?
 -
-
-
 Okay, so I can run it until the entrypoint.
 -
 And fine the .text address with ASLR
 -
-
-
-
 Subtract 0x7000 from what?
 -
-
-
-
-
 So, HyperDbg is supposed to make A28000-0x7000 available?
 -
-
-
-
 Okay, let me test it now.
 -
-
-
-
-
-
-

-

-
 okay, it seems that it works in this case. Am I do it right @ricnar ?
 -
-
-
-
-
-
-
-
 okay, it's a really good test-case. I didn't implement the range page-in yet.
 -
-
 but, just for one page, it works now.
 -
-
-
-
 The only thing that remain unsolved is :
1. Finding a way to run this command in VMI Mode
2. Implement the range page-in -
-
 Yes, I'll do that. But it needs some extra considerations. Like, some pages are allocated with 3-level of paging (big page) with 2 MB granularity. I have to make sure whether the target range is within a 4 KB page or a 2 MB page to avoid injecting page-faults to a single page multiple times. Which will cause a crash in the target process if we didn't truly respect the page granularity as one single page might receive page-faults multiple times.
 -
 I'll push the current version to the github and will continue working on it tomorrow.
 -
-
 yes, but having a range is a better way of handling it 😌
 -
-
 exactly
 -

- 14 July 2023 (14 messages)
-
 @ricnar There is a technical difficulty here in supporting a range in the '.pagein' command that my previous assumption might not work for that. Generally, what we do now, is injecting a #PF in the target guest and set a trap flag in the target process. Then, we ask the user, to press the 'g' which will continue the debugger and once the target debgee continues, the page-fault is delivered to the process and Windows page-fault handler will manage it. Now, how we can halt the debuggee in the target process again? The answer is as we set the RFLAG's TRAP FLAG, the same process (and same thread) will throw a debug break (#DB) and we intercept the target thread again while one instruction is executed there. This approach is totally fine and works perfectly.
But the problem is once, we want to specify a range, we have to either start submitting our requests in a loop and each time run one instruction (because of the trap flag), and bring one page in. This is completely possible, but it's an ugly way of handling issues. Because, once the debuggee is halted again, the target program might be executed several instructions (as the result of the trap flag) and I think it's considered a weird behavior in a debugger.
Previously, my assumption was utilizing the interrupt window exiting in the VMCS, injecting several page faults all at once, and each of them is delivered to the debuggee once the interrupt window is open. This way, we could inject all of the page faults while only one instruction will be executed in the target. But, unfortunately, based on my current tests this approach is proved to be problematic in some cases.
For example, we might inject a #pf once the interrupt window is open but it's not guaranteed that the operating system won't context switch while it's handling an interrupt. So, once the #PF is handled in the OS, the interrupt window is open and we might land on a different process as the OS has already context-switched to another process.
Someone might think that is why we have to use trap flags. Because what other things to use? If for example, we use a breakpoint (0xcc) on the current instruction to avoid running a single instruction, then it's still not a good idea. Why? Because the user might (and will) inject a page-fault while it's operating at a shared Windows library. For instance, assume if the user is in the 'kernel32.dll' and wants to inject a page-fault. If we set a 0xcc on the current instruction of the thread. Other threads from other processes might trigger the breakpoint as the libraries are using the same physical address.
Thus, I believe it's better not to support the range for the '.pagein' command for now because this way the user understands that by injecting one page-fault, one instruction will be executed in the target debuggee. If you guys have any other ideas, please let me know so we can investigate the possible solutions. -
-
 I'm done with testing it. The '.pagein' command is now ready to be used.
 -
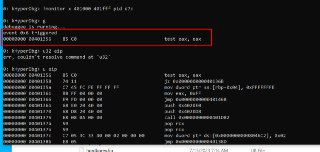
 Btw, make sure to use the 'u2' command, instead of the 'u' because it's 32-bit target.
 -
-
 not yet. I'm working on that right now.
 -
-
-
 Here's the documentation page for the '.pagein' command:
https://docs.hyperdbg.org/commands/meta-commands/.pagein.pagein (bring the page into the RAM)Description of the '.pagein' command in HyperDbg.
-
-
-
-
-
- 15 July 2023 (31 messages)
-
 I didn't get the idea but generally there is no way to allocate memory while HyperDbg is operating at the VMX root-mode. Because, the API functions that we need to call have to be HIGH_IRQL compatible, which none of the memory functions of Windows are designed for this purpose.
 -
 That's why HyperDbg uses it's own pool manager for VMX root-mode.
https://github.com/HyperDbg/HyperDbg/blob/master/hyperdbg/hprdbghv/code/memory/PoolManager.cHyperDbg/hyperdbg/hprdbghv/code/memory/PoolManager.c at master · HyperDbg/HyperDbgState-of-the-art native debugging tool. Contribute to HyperDbg/HyperDbg development by creating an account on GitHub.
-
 But, it would be best if you can clarify it a little bit. 🤔
 -
-
-
-
-
-
-
-
-
-
-
-
-
-
-
-
-
-
-
 Yes, I also thought about this, but the thing is which region? We have to allocate something in the target process. Am I right? So, it's not a good idea for the transparency. If the memory is allocated in the kernel. Still, we cannot move the context from user-mode to kernel-mode. We could forcibly do it but, this way, we'll break the OS semantic as a thread is supposed to spin user-mode while it's currently in kernel-mode. Which doesn't make sense.
 -
 no, of course not. you mean it passed the entrypoint but HyperDbg didn't notice it?
 -
 The !monitor command will continue the guest for some time. How did you prevent it from running? is there any other threads in the process?
 -
-
 yes, but how did you run the !monitor command? I mean setting the !monitor itself runs the debuggee for some time. At this time, the thread will get a chance to be executed (and possibly run the OEP). Previously, I mentioned, even when I make the '.pagein' command, we still need another command to spin the current thread so, we can set the !monitor. But, I remember, you told me you used a dirty trick to halt the current thread. I am right? or is it the lack of the spinning command is problematic right now?
 -
-
 yes, no worries about these problems. whatever happens, I'm here to solve it. 👍
 -
 Joined.
 -
 hi i have Q
 -
 What is this group and how can I benefit from what you are talking about
 - 16 July 2023 (34 messages)
-
 1. If you don't know what this group for , why you are here ? Just random joining from other groups?
2. HyperDbg is an open-source, user-mode, and kernel-mode debugger that relies on hardware features to debug the Windows Kernel and Applications. -
 Joined.
 -
-
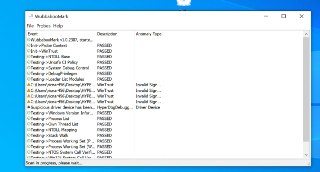
GitHub - hfiref0x/WubbabooMark: Debugger Anti-Detection Benchmark
Debugger Anti-Detection Benchmark. Contribute to hfiref0x/WubbabooMark development by creating an account on GitHub.
-
-
-
-
-
-
 Hi,
Hi,
Yes, I saw it yesterday. For now, it seems that they only check for the object device name of HyperDbg, which can be easily bypassed by using a different name in the source code. However, for the test, it's just a matter of injecting or not injecting #DBs into the guest. Once, I have free time, I'll check that to see how we can bypass its mitigations. -
 Also, @ricnar FYI, I changed the behavior of symbol search, and now the module search is case-insensitive and I almost fixed the issue regarding the loading of SysWow64 modules. I'll let you know once it's finished (probably tonight).
 -
-
 The issue is now fixed. But, I have to test it with several other conditions (hopefully tomorrow) to make sure it works as expected.
https://github.com/HyperDbg/HyperDbg/issues/243
https://github.com/HyperDbg/HyperDbg/commit/249320d8c94086a840b7397d2227effb637ba535Problem with interpreting 32-bit modules in x64 processes · Issue #243 · HyperDbg/HyperDbgHyperDbg treats 32-bit modules in the same way as 64-bit modules, meaning that symbols pertaining to 32-bit modules must be loaded independently.
-
-
 One interesting thing that I didn't know was that symbols (PDB files) for Wow64 DLLs start with a 'w' prefix. For example, 'wntdll.pdb', 'wkernelbase.pdb', 'wuser32.pdb', etc.
 -
I didn't know either
-
 Hypervisor From Scratch - Part 1: Basic Concepts & Configure Testing Environment
We write about Windows Internals, Hypervisors, Linux, and Networks.
-
Joined.
-
How does hyperdbg work to read MSRs ? does it connect to cpu directly?and use cpu instructions to bypass OS ?
is there any debugger to work like that? if no why dont they make like hyperdbg to debugg in user and kernel mode. -
 HyperDbg uses regular WRMSR and RDMSR instructions to read/write on MSR registers.
Please check:
https://docs.hyperdbg.org/commands/debugging-commands/rdmsr
https://docs.hyperdbg.org/commands/debugging-commands/wrmsrrdmsr (read model-specific register)Description of the 'rdmsr' command in HyperDbg.
-
Ollydbg and IDA are not like hyperdbg.
e.x.
I use rdmsr and wrmsr in Ollydbg but it does not work.it comment " privilaged command" . surely,Olly cant go beyond. -
I check it bro👍.
IDA mmm no. I think cant work like hyperdbg,can it?! -
 But if you mean, how HyperDbg intercepts reads/writes to MSR registers, there is something called 'MSR Bitmap' in VMCS of Intel processor. Once you set one bit on this bitmap (memory), each of the read or write access to the corresponding MSR will cause a VM-exit, in which we form it as MSR events.
Please check:
https://docs.hyperdbg.org/commands/extension-commands/msrread
https://docs.hyperdbg.org/commands/extension-commands/msrwrite!msrread (hook RDMSR instruction execution)Description of the '!msrread' command in HyperDbg.
-
IDA can use windbg plugin to debug kernel
-
wooowww 👍.so This is why hyperdbg catch very low events.I mean it works out of regular ring0,3 . below zero.right?
-
 Reading and writing to MSRs needs kernel mode privilege.
 -
 Exactly
 -
ye ye that is a plugin.this is not in its core of the app.
-
 Yes, it works on ring -1. Lower than the operating system.
 -
oo man.that is amazing. hyperdbg is better than othe debuggers by far. I am so womder how you though to make such a practical debugger which can catch high level viruses.
thnk bro👍☕ -
ye which Olly and IDA can not go beyond.not witough plugin.
-
 Thanks. Personally, I don't think that HyperDbg is better than other debuggers, it's just with different capabilities and designed for different purposes. For example, for driver development, of course, WinDbg is better. Or if you want to debug a user-mode application, of course, the best option is x64dbg.
But, sometimes, you need extra information or you need hardware capabilities to assist you in your debugging journey. That's when you can use HyperDbg to ease your analysis or reverse engineering. -
Ye ye I mean hyperdbg capabilities are more practical.You can not catch high level viruses with Olly or IDA(whiich iiss reaallly good)you know that the viruses are on devicedriver layer. is it possoble yo catch boot rootkits or I dont know DKOM attacks with other debuggers?!. in these situations, we need a debugger that works on rings below zero just like hyperdbg not x64dbg.
for normal works normal cracking ye olly , ida , x64 are enough. i know Ida is really good but .... -
part two : ye ye I agree. I need a lot to know about hardware to do so well.
- 17 July 2023 (6 messages)
-
Joined.
-
 I haven't spoken to you. I'm talking to the owner
 -
 Guys, just take a deep breath and chill out.
 -
 Don't take anything seriously.
 -
 We're here to talk about HyperDbg debugger and have discussions of how we can make it a more suitable tool for our reverse engineering experiences.
 -
 Pls ask meaningfully questions, and no fights pls
 - 18 July 2023 (17 messages)
-
 @ricnar The problem with loading 32-bit modules is now completely solved and ready to test.
 -

-
 I test it with your example, "user32!messageboxa". Please note that, based on your previous feedback, it's no longer case-sensitive. 🙃
 -
 Just one more thing, based on my tests, once you start a process (run it by using the '.start' command), the user32 and probably other modules are not loaded into the memory.
 -
 So, in order to bring them into the memory, the '.pagein' command needs to be used.
 -

-

-
-
 I try to release v0.4 now.
 -
-
-
Joined.
-
 HyperDbg v0.4 is released.
https://github.com/HyperDbg/HyperDbg/releases/tag/v0.4.0Release v0.4.0 · HyperDbg/HyperDbgHyperDbg v0.4 is released! If you’re enjoying HyperDbg, don’t forget to give a star 🌟 on GitHub! Please visit Build & Install to configure the environment for running HyperDbg. Check out the Qu...
-
-

-

-
Joined.
- 19 July 2023 (22 messages)
-
Can HyperDbg debug Windows PatchGuard?
-
 Yes. You have plenty of options to monitor PatchGuard.
 -
 https://github.com/tandasat/GuardMon/tree/master
Satoshi Tanda creates a hypervisor years ago to monitor PatchGuard. All of the capabilities that he used in his project are also available in HyperDbg.GitHub - tandasat/GuardMon: Hypervisor based tool for monitoring system register accesses.Hypervisor based tool for monitoring system register accesses. - GitHub - tandasat/GuardMon: Hypervisor based tool for monitoring system register accesses.
-
 For example,
for monitoring debug registers:
https://docs.hyperdbg.org/commands/extension-commands/dr
for monitoring memory:
https://docs.hyperdbg.org/commands/extension-commands/monitor!dr (hook access to debug registers)Description of the '!dr' command in HyperDbg.
-
 Hey, is memory introspection available in v0.4?
 -
 The project that I previously talked about it as memory introspection is not yet available. But, what else do you want better than '!monitor'?
Starting from version 0.4 it's able to intercept Read/Write/Execute from any address range both in the user-mode and the kernel-mode. -
 Does this allow me to monitor reads coming from a driver to unknown memory locations?
 -
 problem is- i'm dealing with a target with virtualized code, so it's much harder to determine from which routines these reads would be coming from
 -
 It's possible to implement such a scenario using !monitor but it's so tricky. Because you might end up blocking the CPU's memory manager from modifying the memory and setting page-table bits. You still need to wait for that memory introspection project.
 -
 But, you have some options here. You can block your target driver from executing in the target machine. Using '! monitor's short-circuiting event.
 -
 And after you can log from the instructions or step through the instructions.
 -
 And, you know, the memory introspection project wouldn't be that much better than this approach.
 -
 Please take a look at:
https://docs.hyperdbg.org/commands/extension-commands/monitor#short-circuiting
@prekvapko!monitor (monitor read/write/execute to a range of memory)Description of the '!monitor' command in HyperDbg.
-
 thanks ❤️
 -
 Did you get the idea?
 -
 I'll read through it.
 -
 Just block the execution of your driver and step through its instructions.
 -
 will be fun on a 14mb sample :D
- 01 Jul 2023 (23)
- 02 Jul 2023 (9)
- 03 Jul 2023 (238)
- 04 Jul 2023 (6)
- 05 Jul 2023 (110)
- 06 Jul 2023 (295)
- 07 Jul 2023 (141)
- 08 Jul 2023 (6)
- 09 Jul 2023 (1)
- 10 Jul 2023 (225)
- 11 Jul 2023 (164)
- 12 Jul 2023 (48)
- 13 Jul 2023 (114)
- 14 Jul 2023 (14)
- 15 Jul 2023 (31)
- 16 Jul 2023 (34)
- 17 Jul 2023 (6)
- 18 Jul 2023 (17)
- 19 Jul 2023 (22)
- 20 Jul 2023 (10)
- 21 Jul 2023 (2)
- 22 Jul 2023 (14)
- 23 Jul 2023 (121)
- 24 Jul 2023 (43)
- 25 Jul 2023 (5)
- 26 Jul 2023 (29)
- 27 Jul 2023 (19)
- 28 Jul 2023 (1)
- 29 Jul 2023 (7)
- 30 Jul 2023 (396)
- 31 Jul 2023 (64)

