- 01 January 2026 (4 messages)
-
Happy new year, wish everyone a great year ahead
-

-
-
Joined.
- 02 January 2026 (1 messages)
-
 Joined.
 - 05 January 2026 (6 messages)
-
 Joined.
 -
Joined.
-

-
-
PVOID
ExAllocatePoolWithTagHook(
POOL_TYPE PoolType,
SIZE_T NumberOfBytes,
ULONG Tag)
{
LogInfo("ExAllocatePoolWithTag Called with : Tag = 0x%x, Number Of Bytes = 0x%x, Pool Type = 0x%x ",
Tag,
NumberOfBytes,
PoolType);
return ExAllocatePoolWithTagOrig(PoolType, NumberOfBytes, Tag);
} -
- 07 January 2026 (7 messages)
-
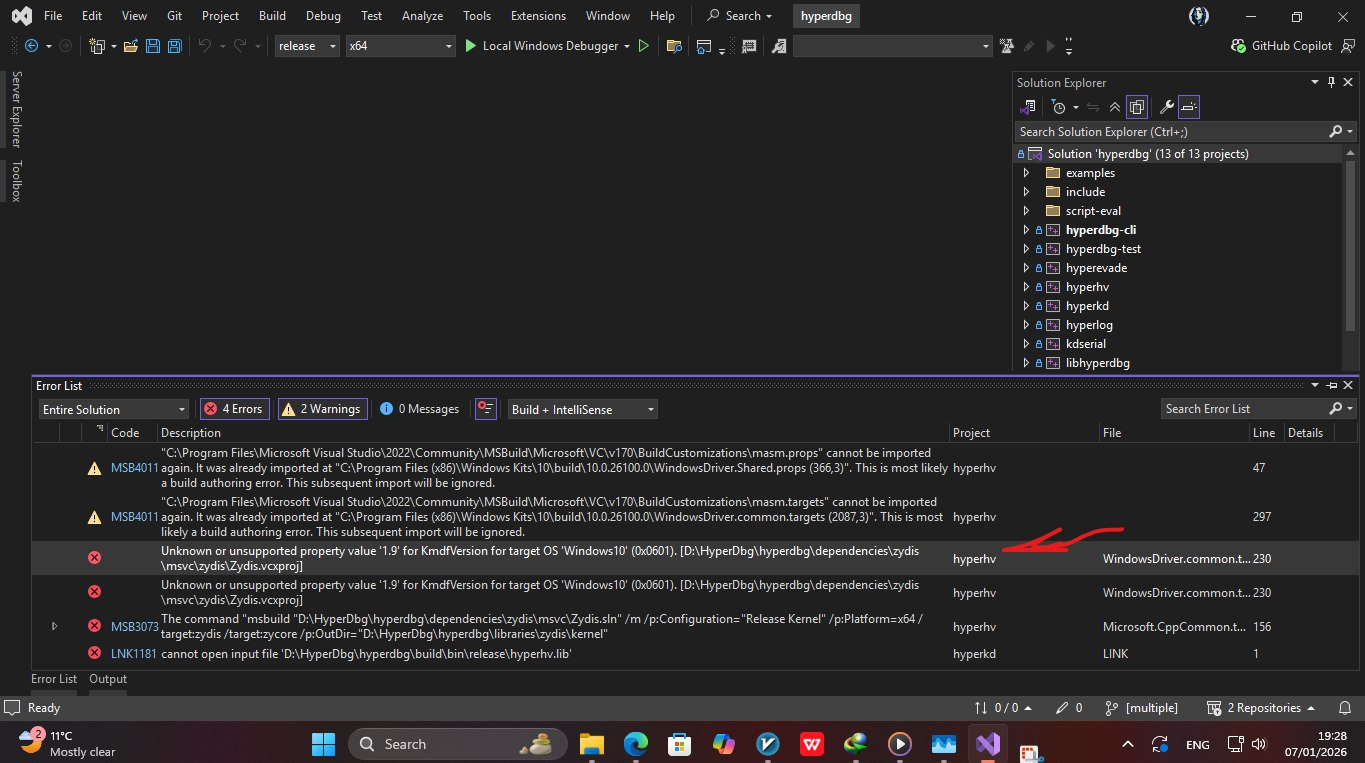
 Unknown or unsupported property value '1.9' for KmdfVersion for target OS 'Windows10' (0x0601). [D:\HyperDbg\hyperdbg\dependencies\zydis\msvc\zydis\Zydis.vcxproj]
 -
Does anyone know how to fix this error?
-
 Hey,
Hey,
You shouldn't use this example. It is old and I don't think that it works anymore. -
If you want to use the classic/detour EPT hook, follow hyperkd.sys's "Debugger.c" routines to see how we called !epthook.
-
@koksdk
This is the function that you need to call to put EPT hooks: https://github.com/HyperDbg/HyperDbg/blob/5462d69dd189cdfca3a889daca3fb6eb8abf080d/hyperdbg/hyperkd/code/debugger/events/ApplyEvents.c#L324HyperDbg/hyperdbg/hyperkd/code/debugger/events/ApplyEvents.c at 5462d69dd189cdfca3a889daca3fb6eb8abf080d · HyperDbg/HyperDbgState-of-the-art native debugging tools. Contribute to HyperDbg/HyperDbg development by creating an account on GitHub.
-
Hey
This is the problem of new SDK with zydis. -
@mojtabafaaleh
use this solution. - 08 January 2026 (2 messages)
-
Tnx ❤️❤️❤️
-
 Joined.
 - 12 January 2026 (2 messages)
-
Thanks❤️
-
Joined.
- 16 January 2026 (1 messages)
-

- 21 January 2026 (21 messages)
-
Does anyone have a hyper that can bypass CR3?
-
I would like to separate it out as a standalone entity.
-
 What do you mean by that?
 -
That is, there’s no need to use hyperdbg.
-
But wanting to use it
-
I would like to bypass the CR3 check.
-
Where does this check come from? Please provide more context
-
The process itself includes integrity checks.
-
So I’m unable to modify that code snippet.
-
PulseDbg of mine is an isolated hypervisor. It is not open source, but it has SDK. It also requires two physical machines for debugging. Don't know if it helps in your situation.\
-
Is it an open-source program? I can give it a try.
-
Yes, I need a hypervisor.
-
I want to create a crack patch.
-
However, the program itself includes a CR3 check.
-
Therefore, I would like to use a hypervisor to make these modifications without leaving any traces.
-
Sorry, we don't discuss cracks or harmful patches here
-
Lol, what I cracked was a Trojan program.
-
So this is legal, bro.
-
Okay, gotcha!
-
Feel free to DM me with further questions about pulsedbg then
-
 hello there can I have a list of resources to learn how hypervisors work and how to develop them?
 - 22 January 2026 (2 messages)
-
me too
-
This might be helpful:
https://github.com/Wenzel/awesome-virtualizationGitHub - Wenzel/awesome-virtualization: Collection of resources about VirtualizationCollection of resources about Virtualization. Contribute to Wenzel/awesome-virtualization development by creating an account on GitHub.
- 24 January 2026 (4 messages)
-
when are you going to publish the 9th part of your series hypervisor from scratch?
-
Well, writing a new hypervisor from scratch requires at least three months of dedicated research and development. Given my current obligations, I can't devote that much time at the moment. However, I hope my schedule becomes less busy in the future so I can write another one.
-
what prior knowledge do I need to develop hypervisors?
-
 you could check out intel IA-32
 - 25 January 2026 (5 messages)
-
is amd harder to dive in ?
-
the hypervisors i saw were all intel vt-x based 😂 i dont know much about AMD there might be less resources
-
 C/C++ ( atleast 3 - 5 year experience )
ASM
IA-32 -
This might be helpful:
https://github.com/Wenzel/awesome-virtualizationGitHub - Wenzel/awesome-virtualization: Collection of resources about VirtualizationCollection of resources about Virtualization. Contribute to Wenzel/awesome-virtualization development by creating an account on GitHub.
-
This is a good tutorial; I hope I can use it to implement hyper.