- 19 July 2023 (22 messages)
-
 but I'll probably find the most interesting part by api intercepting
 -
 It's a little bit too much but you can test it, maybe it works.
 -

-
 Yes, exactly. Try to make it as small as you can.
 - 20 July 2023 (10 messages)
-
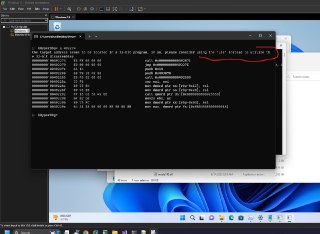
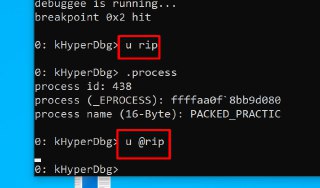
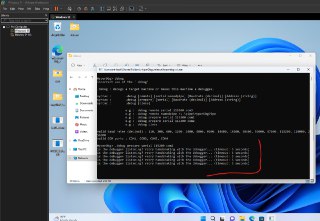
 As I saw you and others (including me) are using the 'u' command mistakenly to debug 32-bit program (instead of the 'u2' or the 'u32'), HyperDbg now shows a warning message that the disassembler doesn't match with the context to notify user if the wrong command is used!
(These modifications are available in the 'dev' branch) -
-
-
 Hi
Hi -
-
 Previously (even in the very first version 0.1) we had the 32-bit disassembler (it was the 'u2' command). But, as I saw you used the 'u32' instead of the 'u2', I decided to add an alias for the 'u2' which is the 'u32'. Now, in the version v0.4 you can use either the 'u2' or the 'u32'. These commands are the same.
 -
-
 But in the 'dev' branch, there is an additional warning message that will notify you if you mistakenly used the 'u' command instead of the 'u32'.
 -
-
 🙏
🙏 - 21 July 2023 (2 messages)
-
-
Joined.
- 22 July 2023 (14 messages)
-

-

-

-
 No, there isn't such a functionality in HyperDbg.
 -
 And it's kinda hard to implement
 -
 Because, the script evaluation is done in both kernel-mode and user-mode but as you're tracking the system-calls, you're using its kernel-side scripting. But the symbol interpreter is completely a user-mode module. So, connecting them is kinda hard as you just see the results of evaluation from the kernel debugger in the user-mode.
 -
 One idea to solve this problem is using the event-forwarding mechanism. You need to add your custom functions there to interpret your syscall outputs.
https://docs.hyperdbg.org/tips-and-tricks/misc/event-forwardingEvent forwardingBrief explanation about Event Forwarding Mechanism
-
 For example, write a custom function that imports symbols (converting them from addresses to function names) and once the result of event forwarding is arrived in the user-mode, try to interpret them.
 -
 Here's the function @fuijio :
https://github.com/HyperDbg/HyperDbg/blob/c20e2dfc441802bebd69df6ecc9aac17b49c284a/hyperdbg/hprdbgctrl/code/debugger/communication/forwarding.cpp#L292HyperDbg/hyperdbg/hprdbgctrl/code/debugger/communication/forwarding.cpp at c20e2dfc441802bebd69df6ecc9aac17b49c284a · HyperDbg/HyperDbgState-of-the-art native debugging tool. Contribute to HyperDbg/HyperDbg development by creating an account on GitHub.
-
 You can add your codes that convert address to function name here.
 -
 But, it's not a good idea to implement such functionality for the HyperDbg as it violates the design principles of not making the scripts interpretation in the user side. (only good for custom use).
 -

-

-

- 23 July 2023 (121 messages)
-
 Yeah, I don't like your flooding. Quiet now Ricardo!
 -
 🤦♂️
🤦♂️ -
 Oh, sorry @ricnar can you send message now?
 -
 This automated bot seems to be incorrectly configured.
 -
 /flood
 -
 This chat is currently enforcing flood control upon reaching 30 messages. Any users that reach that amount of messages will be muted.
Flood clearing is enabled, so messages that trigger a flood will be deleted. -
 /setflood 100
 -
 Antiflood settings for HyperDbg have been updated to 100
 -
 Why this stupid Bot deleted the messages. 🫠
 -
 i have a problem with x option of monitor command
i start the packed sample again
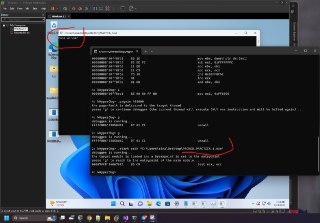
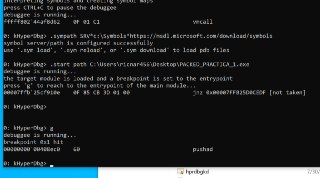
.start path C:\Users\ricnar456\Desktop\PACKED_PRACTICA_1.exe
debuggee is running...
the target module is loaded and a breakpoint is set to the entrypoint
press 'g' to reach to the entrypoint of the main module...
00007ffb`25cf910e 0F 85 CB 3D 01 00 jnz 0x00007FFB25D0CEDF [not taken]
0: kHyperDbg> g
debuggee is running...
breakpoint 0x2 hit
00000000`00408ec0 60 pushad
it stops in entry point
the section 401000 is not paged
i type pagein 401000
0: kHyperDbg> db 401000
err, invalid address (c0000005)
0: kHyperDbg> pagein 401000
the page-fault is delivered to the target thread
press 'g' to continue debuggee (the current thread will execute ONLY one instruction and will be halted again)...
0: kHyperDbg> g
debuggee is running...
00000000`00408ec1 BE 00 80 40 00 mov esi, 0x408000
0: kHyperDbg> db 401000
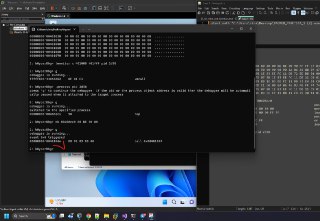
00000000`00401000 00 00 00 00 00 00 00 00 00 00 00 00 00 00 00 00 ................
00000000`00401010 00 00 00 00 00 00 00 00 00 00 00 00 00 00 00 00 ................
00000000`00401020 00 00 00 00 00 00 00 00 00 00 00 00 00 00 00 00 ................
00000000`00401030 00 00 00 00 00 00 00 00 00 00 00 00 00 00 00 00 ................
00000000`00401040 00 00 00 00 00 00 00 00 00 00 00 00 00 00 00 00 ................
00000000`00401050 00 00 00 00 00 00 00 00 00 00 00 00 00 00 00 00 ................
00000000`00401060 00 00 00 00 00 00 00 00 00 00 00 00 00 00 00 00 ................
00000000`00401070 00 00 00 00 00 00 00 00 00 00 00 00 00 00 00 00 ................
401000 block is paged now
my process is
0: kHyperDbg> .process
process id: 10d8
process (_EPROCESS): ffffaa0f`882b3300
process name (16-Byte): PACKED_PRACTIC
pid 10d8
!monitor xw 401000 401fff pid 10d8
y put a monitor command in wx
in this block and press G
0: kHyperDbg> g
debuggee is running...
event 0x1 triggered
00000000`00408f81 89 07 mov dword ptr ds:[edi], eax
and it stops when writing
event 0x1 triggered
00000000`00408f81 89 07 mov dword ptr ds:[edi], eax
0: kHyperDbg> db 401000
00000000`00401000 55 8B EC 5D C3 CC CC CC CC CC CC CC CC CC CC CC U..]............
00000000`00401010 55 8B EC 8B 45 0C D1 E0 39 45 08 75 06 B0 01 EB U...E...9E.u....
00000000`00401020 04 EB 02 32 C0 5D C3 CC CC CC CC CC CC CC CC CC ...2.]..........
00000000`00401030 55 8B EC B8 00 00 20 18 5D C3 CC CC CC CC CC CC U..... .].......
00000000`00401040 55 8B EC 8B 45 14 50 8B 4D 10 51 8B 55 0C 52 8B U...E.P.M.Q.U.R.
00000000`00401050 45 08 50 E8 00 00 00 2C 8B 48 04 51 8B 10 52 FF E.P....,.H.Q..R.
00000000`00401060 15 00 00 10 BC 83 C4 18 5D C3 CC CC CC CC CC CC ........].......
00000000`00401070 55 8B EC 81 EC 94 00 00 00 A1 00 00 20 04 33 C5 U........... .3.
no instruction is executed in this block till now
0: kHyperDbg> event c 1
0: kHyperDbg> event
!monitor x 401000 401fff pid 10d8
now i put a monitopr command in the block
0: kHyperDbg> g
debuggee is running...
the programs runs and does not stop at all -

-
 i know the monitor command starts executing and bypass the first instructions exxecuted
but is not useful in this form
some block of the target is needed
The activation of w option is more accurate more quick -
 I copied all of you deleted messages @ricnar. Can you send messages here now? This Rose bot seems to be wrongly triggered by flood detection. 🤦♂️🤦♂️🤦♂️
 -
 Okay, as long as I see, it seems to be a problem that the event is not triggered for the 'execution'. Am I right?
 -
-
-
-
 I'm testing it now.
 -
 I'm currently testing this "PACKED_PRACTICA_1.exe", are we testing the same binary file?
 -
 And also, 401000 is a separate PE section. Am I right? @ricnar
 -
 I mean is it a PE section or later this program allocate it using VirtualAlloc?
 -
-
-
-
-
-
-
-
-
-
 okay, I will test it now, and will let you know about the results.
 -
-
-
-
-
-
-
-

-
 3: kHyperDbg> !monitor x 401000 401fff pid 2d38
2: kHyperDbg> g
debuggee is running...
fffff806`33858d62 0F 01 C1 vmcall
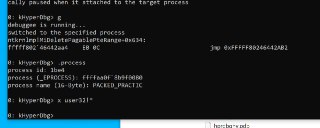
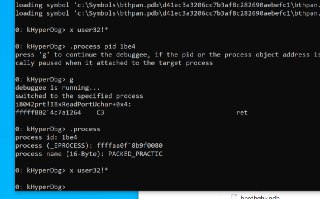
0: kHyperDbg> .process pid 2d38
press 'g' to continue the debuggee, if the pid or the process object address is valid then the debuggee will be automatically paused when it attached to the target process
0: kHyperDbg> g
debuggee is running...
switched to the specified process
00000000`00408ec1 90 nop
2: kHyperDbg> eb 00408ec0 60 BE 00 80
2: kHyperDbg> g
debuggee is running...
event 0x0 triggered
00000000`0040146e E8 90 03 00 00 call 0x00401803 -
 @ricnar is it the first line that is supposed to be executed? Am I right?
 -
-
 yes, because you didn't spin the thread.
 -
 This one .
 -
 As it's mentioned in the docs, HyperDbg continues the debuggee for some time in case of events. And your target thread will be continued for some time, that's why you didn't get it there.
 -
 I agree this is a really bad issue and events should be applied immediately.
 -
 BTW, I fix it with this simple command:
eb @eip 90 90 eb fc -
 Let me create a short video to show you what I did to get this entrypoint.
 -
 I'm gonna record it now.
 -
-
 Yes
Yes -
 At the entry point
 -
 And then applied the !monitor.
 -
-
 But, please use the latest 'dev' branch commits.
 -
 There was a small problem (not related to monitor) in parsing 'eb' that is now fixed.
 -

-
 This is how I reached the entrypoint, I'm sure you already got the idea of infinite loop. @ricnar
 -
 And again, make sure to use the 'git pull' on the 'dev' branch. 🙂
 -
-
-
 🙏
🙏 -
 Let me know, if there is any other problems.
 -
A video is not necessary
-
 I already sent it.
 -
 .
. -
-
-
-
-
-
-
-
-
-
 Can you reproduce it? Generally, if you find a way to instruct me how to reproduce it, I can fix it easily.
 -
 Because these bugs are usually easy to investigate. But, as I never reached to these bugs, I didn't fix it.
 -
-
-
 Are you using compiled binaries?
 -
 Or using the 'dev' branch
 -
 ?
? -
-
 Can you show me the signature of the debugger?
 -
-
-
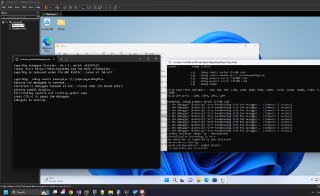
 No, I mean just open HyperDbg, and there is a signature at the top of the window.
 -
 Yes
Yes -
-
 This binary is compiled on 15th July.
 -
-
-
-
-
 Are you sure? Because it's compiled on 15th July. Not today, or yesterday.
 -
-
-
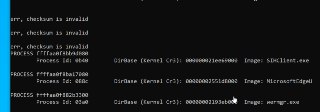
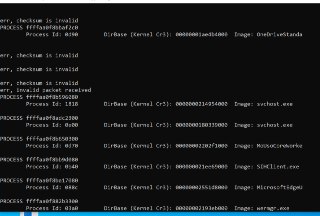
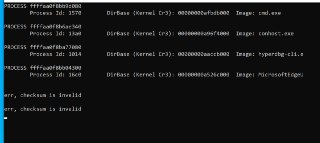
 That's exactly why you see 'invalid checksum'.
 -
 Because the structure and the headers of the newest version of HyperDbg is different from the previous versions.
 -
-
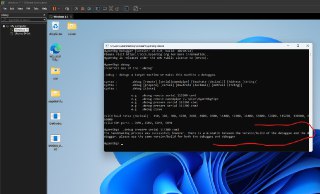
 This one is also in the to-do list to check the version of HyperDbg on both debuggee and debugger to make sure they match.
 -
 This will prevent such errors.
 -
 The reason why the 'u' command not worked in your case is because you use a 64-bit disassembler which might not find the target assembly as a valid opcode. And as the result, it won't show any result.
 -
 But as you know, the newest 'dev' commit will notify you about this to avoid these problems. 😉
 -
-
-
-
 I'm gonna go sleep now. Let me know if there is anything wrong there. I'll fix it tomorrow. 😴🥱
 -
-
-
-
-
-
-
-
-
-
-
 When @ricnar joined the group, and knowing him as a professional person, I told @HughEverett, 'Prepare yourself for many challenges ahead.' 😊
Thank you guys. -
-
- 24 July 2023 (43 messages)
-
-
 The VMs serial connections should not be prone to errors. It's weird, I'll check it. 🤔
 -
Hyperdbg Instalacion en dos VM y nuevos features(Hyperdbg Instalation in two VM and new features.)
https://drive.google.com/file/d/1S6Dz2qqYYDD3gMxDwVFf0ihobulhMrRP/view?usp=sharing empacado password a
-
-
 Wow, it's great.
 -

-
 You are doing great @ricnar. And what about your course @HughEverett?
 -
 It will be finished once the video editor makes the necessary changes.
 -
 probably next week.
 -

-

-

-
-
-
 Starting from the next version, HyperDbg will check whether the build and the version of the debuggee and debugger match or not and if it didn't match then it prevents you from loading the driver. It's mainly added to prevent errors (such as yesterday's error @ricnar) with version mismatch of HyperDbg. And also, the debuggee driver won't load until it's sure that the debugger is listening to it.
 -
-
 Do you mean the interconnection error ?
 -
-
-
 Okay, I'll setup and test two VMs tomorrow to find out the problem.
 -
-
-
 🤔🤔🤔
🤔🤔🤔 -
 That could be.
 -
-
-
 🤔
🤔 -
-
-
 So, it means that each time you use commands like '.process list', it shows error?
 -
-
-
-
-
-
 Got it, maybe the problem that @prekvapko previously mentioned about physical COM port is also related to this.
 -
-
-
 I think it should be possible. A portion of the 'kdnet' is open-source:
https://learn.microsoft.com/en-us/windows-hardware/drivers/debugger/kdserial-extensibility-code-samplesKDNET Serial, and KDSerial extensibility code samples - Windows driversDebugging Tools for Windows supports extending the KDNET serial transport.
-
 We could borrow the kdnet source code and use it as the wrapper for HyperDbg.
 -
-
-
Joined.
- 25 July 2023 (5 messages)
-
 I need more time testing it. right now I have to finish HyperDbg course, after that, I'll get to it.
 -
 I haven't checked the panel, has a new lesson been added?
 -
 No, but probably a new addition to the previously recorded '!monitor' for the execution interception will be added.
 -
 So don't update Hyperdebug for now until the course is published. 😁
 -
 Joined.
 - 26 July 2023 (29 messages)
-

-

-
 Hi,
Hi,
You can use HyperDbg in VMI Mode without connecting two machines. It's like Local Kernel Debugging. -
 But, you cannot pause or step the debuggee.
 -
 Other than that, all of the features of HyperDbg is supported in VMI Mode.
 -

-
 Can you use a virtual machine?
 -
 Like VMware workstation.
 -

-
 HyperDbg is VT-x based debugger itself. So, you can test it with your process, first enter the VMI Mode and then run your target process, if it detects HyperDbg, then it means more checks are needed to be bypassed, other than that, you can trace your target process (stepping instructions is only supported in the Debugger Mode) but you can trace any memory read/write/executions. You simulate stepping through the instructions by using event short circuiting, etc.
 -
 But before that, run your debuggee along with HyperDbg and check whether it's detected or not after that you can tell us about the scenario of which you need to apply to your target debuggee (e.g., I want manipulate files accessed by this process, I want to monitor/change the network connections from this process), so we could tell you what feature of hyperdbg works best for you.
 -
 Ideally im looking to just trace a specific thread, its obfuscated heavily however I would just manually analyse the instructions as I have narrowed it down to a specific area however I cannot backtrace as the stack and stacktrace are messed up so I have no idea where the previous instructions are, IDA does not show and XREFS
 -

-
 Do you know if it's deobfuscated in the memory after passing its checks?
 -

-

-
 This is really hard, not just with HyperDbg, with other debuggers as well. If I were in you shoes, I try to monitor its interactions with the operating system. For example, most of the times, you don't need to deobfuscate a really messy binary file. Instead, you just need to manipulate its interactions. For example, this application performs dozens of check, and if it's sure that the integrity of the application is untouched, it contacts its target server. In such a scenarios, you don't need to make your hands dirty deobfuscating it, instead monitor its system-calls is enough.
 -
 Yes I know, im in a tricky situation. I know exactly what your saying as I have been doing that for a while now lol. My problem is im sure its a hearbeat which could just be a shared/global variable being used which means there is no system calls. Ill maybe check other areas but its a tricky one
 -
 Other that, you can use HyperDbg's !exception command. Once the system wants to context-switch to another process, it throws a clock-interrupt. You can simply monitor that and it has the full state of the system (registers, memory, whatever). From there you can change the flow (direction) of program or read the memory, etc.
https://docs.hyperdbg.org/commands/extension-commands/exception!exception (hook first 32 entries of IDT)Description of the '!exception' command in HyperDbg.
-
 Do you know the address of this shared global variable?
 -
 If you know the address of it, you can '!monitor' that in HyperDbg.
 -

-

-
 HyperDbg can work over TCP in VMI mode.
Is it what you need?
https://docs.hyperdbg.org/commands/meta-commands/.connect#examples.connect (connect to a session)Description of the '.connect' command in HyperDbg.
-

-

-

-
 Yes, it's like connecting to a remote instance of HyperDbg. You can use the '.listen' command and then the '.connect' command.
Take a look at this:
https://docs.hyperdbg.org/getting-started/attach-to-hyperdbg/debug#connect-to-debuggee-vmi-modeAttach to a remote machineRemote debugging in VMI Mode and Debugger Mode
-
 And for the automation, you can change the source code of this file which implements the logic behind listening and connecting:
https://github.com/HyperDbg/HyperDbg/blob/master/hyperdbg/hprdbgctrl/code/debugger/communication/remote-connection.cppHyperDbg/hyperdbg/hprdbgctrl/code/debugger/communication/remote-connection.cpp at master · HyperDbg/HyperDbgState-of-the-art native debugging tool. Contribute to HyperDbg/HyperDbg development by creating an account on GitHub.
- 27 July 2023 (19 messages)
-
 @ricnar I tested two VMs debugging over COM port.
 -

-

-
 I couldn't reproduce the error. It didn't show any checksum failed after 1 hour of continuously transmitting data.
 -
 Both '.sym reload' and '.process list' gives a correct response without 'checksum error'. I test it serveral times. Do you have any idea how can reproduce the error? probably other ways?
 -
 What version of VMware workstation do you use? Mine is 16.2.4.
 -
-
-
-
-
-
-
 I did the same, but it still works perfectly. (I mean transferring data, not noticing that the target is disconnected.).
But, I test it with the latest pre-compiled binaries released in the GitHub. It didn't work! But, the latest 'Dev' branch commit works perfectly. -
 Two/three days ago, I made some modification for handshaking between the debugger and the debuggee. In that 'commit' I made some modification on the COM timeout, etc.
 -
 I suspect that it might accidentally solve this problem!
 -
 Would you please test it with the latest dev branch commit ("remove user-mode debugger trap flag ignorance")? @ricnar
 -
 Okay, the serial connection over two virtual machines is now documented here: https://docs.hyperdbg.org/getting-started/attach-to-hyperdbg/debug#vmware-workstation-two-vmsAttach to a remote machine
Remote debugging in VMI Mode and Debugger Mode
-
I will test the weekend thanks
-
Joined.
- 28 July 2023 (1 messages)
-

- 29 July 2023 (7 messages)
-
-
Hyperdbg Instalacion en dos VM y nuevos features(Hyperdbg Instalation in two VM and new features.)
https://drive.google.com/file/d/1S6Dz2qqYYDD3gMxDwVFf0ihobulhMrRP/view?usp=sharing empacado password a
-
 It's great. Thank you for all of your efforts. 🙏
 -
-
-
 Certainly not! Numerous individuals contribute to make this infrastructure run smoothly and of course I'm not the only one.
 -
- 30 July 2023 (396 messages)
-
-
 Is the 'checksum error' problem in the connection between two VMs fixed? 🤔
 -
-
-
-
-
-
-
-
-
-
-
 That's great. @prekvapko Do you still have access to your computer with physical serial port? Can you please check HyperDbg (in the 'dev' branch) whether the problem with serial connection is solved or not?
 -
-
-
 Yeah, I noticed it too.
 -
-
-
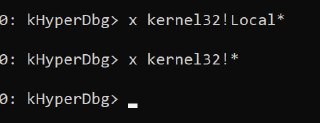
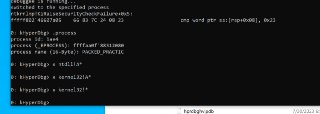
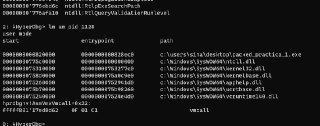
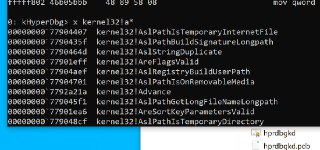
 I don't know why kernel32's symbol is problematic. Let me see it again.
 -
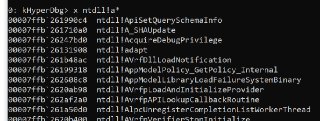
 No, I don't think so, because user32, ntdll, all of them except kernel32 is okay.
 -
-
-
 The same problem is with kernel32, 64 bit.
 -
-
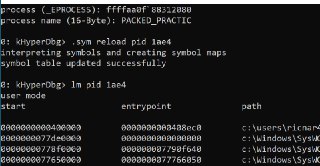
 Did you run '.sym reload pid xxx' ?
 -
-
-
 Will do!
 -
-
-
-
 with a 32-bit program?
 -
-
-
 Let me check it now.
 -
-
-
-
-
-
 It loaded successfully for me.
 -
 On PC now, will check the physical conn now
 -
-
-
 yes, the '.process' can be used to return to the previous process again.
 -
-
-
 It won't get the context?
 -
-
-
 yes, this is expected.
 -
-
 Well, it's actually how we implement the '.process'. Take a look at this:
https://docs.hyperdbg.org/tips-and-tricks/considerations/difference-between-process-and-thread-switching-commandsDifference between process and thread switching commandsWhen to use '.process', '.process2', '.thread', and '.thread2' commands
-
-
 You have a really cool trick to avoid this problem. Let me explain.
 -
 The way that HyperDbg grabs the execution in the '.process' command is monitoring for clock-interrupts. Once a clock-interrupt is thrown in the target process, we intercept the execution.
 -
 The problem why you can't get the execution right now, is because functions like get() will eventually call the 'WaitForSingleObject()', and the execution will go to the Windows kerenl.
 -
 Windows won't execute the target program and won't assign it a time slice as the thread is still in the waiting state (waiting for an input from user).
 -
 And the target thread won't get a chance to get executed and as the result, HyperDbg is not able to intercept the execution.
 -
 How can we fix it?
 -
 Well, we have a really cool trick for it 🙂
 -
-
 You can use the '!monitor x' command on the target range of the packed process.
 -
 Once you provide the input to the process, the execution will be returned to the user-mode.
 -
-
-
 The execution will be intercepted in the user-mode. As we !monitor it for the 'x' attribute.
 -
-
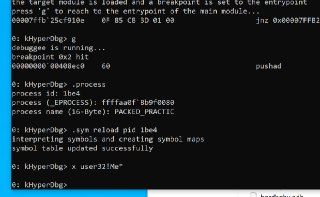
 I verified that the 'kernel32' symbols have problem, but other modules are okay?
 -
-
-
 So, what's the problem? 🤨
 -
-
 are you sure that the 'user32' symbol is available?
 -
 This is a 32-bit version, so it needs to be re-downloaded.
 -
 Most of the times, people have symbols for user32 (64-bit) version.
 -
 Can you run '.sym download' now?
 -
-
-
-
-
 👌👌👍
👌👌👍 -
-
-
 again '.sym reload pid xxx'.
 -
 and take a look at the '.sym table'.
 -
-
-
-
-
 I don't get it, what do you mean? 🧐🤔
 -
-
-
-
-
-
 😳😳😳
😳😳😳 -
-
 Let me check.
 -
-
-
-
-
 I'm checking it now.
 -
-
-
-
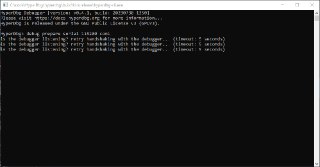
 Unfortunately still met with invalid packet received spam
 -
-

-
-
 The problem is, the target process didn't load the user32.
 -

-
-
 As I traced it, the problem is with dbghelp symbol interpreter.
 -
 Oh no
Oh no -
 I'm wrong
 -
 It works for the kernel32 as well.
 -
-
-
-
-
-
-
-
 I think this can be solved. I'm not sure about the kernel part but I think I can solve it to not continue the debuggee in case of the '.sym' command.
 -
 I'll put it to the to-do list.
 -
-
-
-
 💃
💃 -
 At least the same problem is solved now for VMware workstation.
 -
-
-
-
 invalid packet spam seems to still be correlated to symbol sync
 -
 or at least gets spammed around that time
 -
 Did you use the latest 'dev' branch?
 -
 yup
yup -
 🤔
🤔 -
 wait
wait -
 no
no -
 i didnt
 -
 LOL
LOL -
 welp time for another test
 -
 after i finish my game
 -
 i always forget that cloning from url clones master..
 -

-
-
 yes.
yes. -
 wouldn't you lost the ability to break in the guest?
 -
 over physical machines**
 -
 In VMware?
 -
 over physical machines
 -
 2pcs
2pcs -
 I didn't test it right now on physical machine. But the same problem that you mentioned happened to VMWare connecting two VMs, and now we fixed it. That's why I asked you to re-test HyperDbg on your physical machine as the same problem might be solved there as well.
 -
 I'm talking about NET connections
 -
 Oh
Oh -
 nvm.. you can't really use anything besides com
 -
 because yo uneed __in and __out with bios directly
 -
 Yes, that's definitely possible, but I need some times before supporting this feature. Right now, a lot of critical problems are still on the to-do list that needs to be solved.
 -
 If you guys have time can helping me too. We need someone to test the KDNET project which its source code is available in Win SDK, to compile it and test it and possibly add it to HyperDbg.
 -
 It's a little bit time consuming as we need to re-test everything to make sure we didn't break anything.
 -

-
 still invalid checksum on first msg
 -
 and then invalid packets..
 -
 no, it's not an invalid packet
 -
 How did you connect it?
 -
 wait
wait -
 com ports 115200
 -
 on debugger: .debug remote serial 115200 com2
 -
 yes
yes -
 it's debug 'remote'.
 -
 and prepare on guest
 -
 yes
yes -
 I followed the wiki
 -
 It won't connect at all?
 -
 This message indicates that it's not connected.
 -
 debugger will show messages
 -
 invalid checksum, invalid packets
 -
 🤦♂️
🤦♂️ -
 it did not pass handshake, packets are being sent nontheless
 -
 i run debug remote serial 115200 on my laptop com3
 -
 first
first -
 are you sure both the debuggee and debugger use the same version?
 -
 The same compilation I mean.
 -
 yup
yup -
 i always download from guest where i compiled it
 -
 Something is wrong here. Let me check it with you carefully.
 -
 Because once you see some messages in debugger (not debuggee), the debuggee should also show some messages.
 -
 what if the debugger received the messages, but was unable to process them
 -
 therefore it didn't respond?
 -
 No
No -
 That's not possible.
 -
 Because the debugger should send response to debuggee.
 -
 And if this message is not received in the debuggee, it won't send any messages there.
 -
 one second
 -
 That's why I say, something is went wrong here.
 -

-
 multiple invalid packet prints show on debugger every time debugee is retrying
 -
 Can you use '115200' as baud rate?
 -
 I just tried 110 for test.
 -
 Used 115200, same result
 -
 okay, what's received there?
 -
 exactly the same
 -
 I will try one more thing, don't think it will have an effect
 -
 I have an extension on the com cable
 -
 This seems not to be a problem with the communication.
 -
 Please take a look at source code (put breakpoint) and see what it keeps sending there.
 -
 Because we don't have such a mechanism that keeps sending something like this
 -
 🤔
🤔 -
 weird thing is, when i was checking it before
 -
 the packets seemed to have been very weird?
 -
 like I was receiving packets from debugee that should've came from debugger?
 -
 and I swear i did not accidentally use it the opposite ways
 -
 yes. I'm curious to know what received there that makes it show this message.
 -
 yes
yes -
Joined.
-
 aight one second i'll pull the repo on laptop
 -
 where would you like me to put the breakpoint?
 -

-
 welp problem is that Indicator is wrong
 -
 for every but one message
 -
 and the first message has wrong checksum
 -
 maybe I need to make the maximum size over COM smaller?
 -
 perhaps something is cut off?
 -
 what is received there in the 'BufferToReceive' and the 'LengthReceived'?
 -
 No, it won't send the entire buffer, just the length that is filled is sent.
 -
 welp looking at buffer
 -
 buffer+0x8 has following string: GDBREPY
 -
 Wait
Wait -
 where is H?
 -
 a bit later i see \\hyperdbg\\
 -
 missing
 -
 oh
oh -
 H is after the Y
 -
 GDBREPYH
 -
 my bad
 -

-
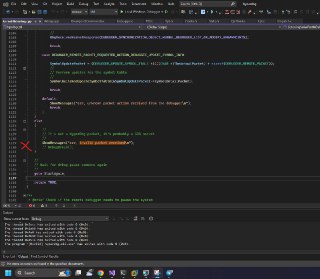
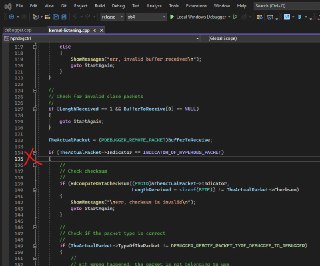
 put a breakpoint here.
 -
 .
. -
 next one sends over symbols
 -
 SYSTEM32\\ntdll.dll
 -
 What is the value of the 'TheActualPacket->Indicator' and how it's compared to INDICATOR_OF_HYPERDBG_PACKET?
 -
 wait is it maybe because
- 01 Jul 2023 (23)
- 02 Jul 2023 (9)
- 03 Jul 2023 (238)
- 04 Jul 2023 (6)
- 05 Jul 2023 (110)
- 06 Jul 2023 (295)
- 07 Jul 2023 (141)
- 08 Jul 2023 (6)
- 09 Jul 2023 (1)
- 10 Jul 2023 (225)
- 11 Jul 2023 (164)
- 12 Jul 2023 (48)
- 13 Jul 2023 (114)
- 14 Jul 2023 (14)
- 15 Jul 2023 (31)
- 16 Jul 2023 (34)
- 17 Jul 2023 (6)
- 18 Jul 2023 (17)
- 19 Jul 2023 (22)
- 20 Jul 2023 (10)
- 21 Jul 2023 (2)
- 22 Jul 2023 (14)
- 23 Jul 2023 (121)
- 24 Jul 2023 (43)
- 25 Jul 2023 (5)
- 26 Jul 2023 (29)
- 27 Jul 2023 (19)
- 28 Jul 2023 (1)
- 29 Jul 2023 (7)
- 30 Jul 2023 (396)
- 31 Jul 2023 (64)
